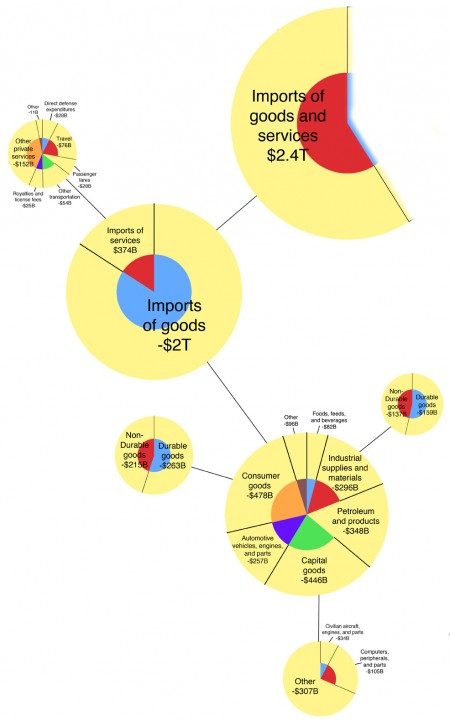
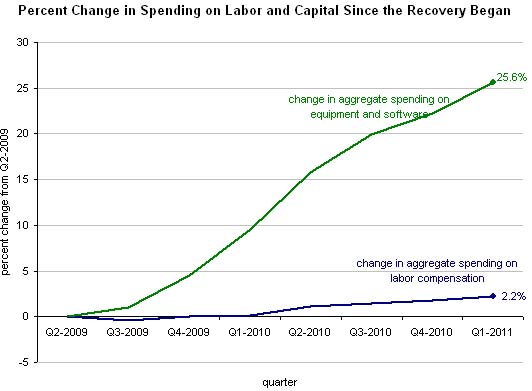
 [Chart via NYTimes]
How Much Would You Pay for Freedom?

[Photo: Damn]
It’s Always ______ in Philadelphia
What happens when you adjust median household income for the cost of living? In some ways, nothing. On the left, we have a bunch of wealth suburbs that remain as such after the change. On the right, we have a bit of reality, which the respective populations are likely already painfully aware of… But, here’s the numbers, just in case:
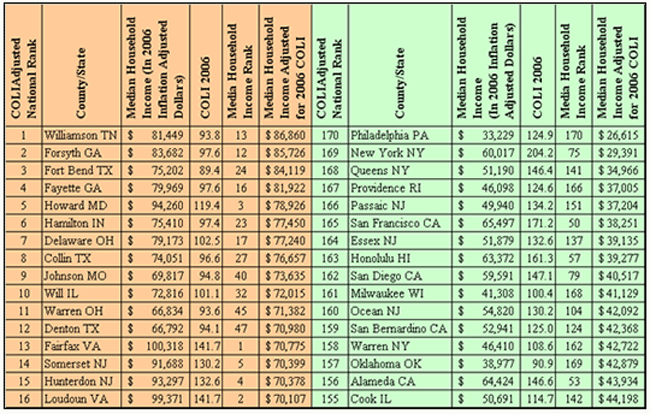
[Chart from The Council for Community and Economic Research]
Do You Believe?
Amazon’s Risk Factors make for Bad Corporate Poetry
We face intense competition.
Our expansion places
a significant strain
on our management, operational, financial and other resources.
Our expansion into
new products, services,
technologies and geographic regions
subjects us to
additional business, legal,
financial and competitive risks.
We may experience significant fluctuations
in our operating results
and growth rate.
We may not be successful in our efforts
to expand
into international market segments.
If we do not successfully optimize
and operate
our fulfillment centers,
our business could be harmed.
The seasonality of our business
places increased strain
on our operations.
Our business could suffer
if we are unsuccessful
in making, integrating, and maintaining
commercial agreements, strategic alliances, and other business relationships.
Our business could suffer
if we are unsuccessful
in making, integrating, and maintaining
acquisitions and investments.
We have foreign exchange risk.
The loss of key senior management personnel could
negatively affect our business.
We face risks
related to system interruption
and lack of redundancy.
We face significant inventory risk.
We may not be able to adequately protect our intellectual property rights
or may be accused of infringing intellectual property rights of third parties.
We have a rapidly evolving business model
and
our stock price is highly volatile.
Government regulation is evolving and
unfavorable changes could harm our business.
Taxation risks could subject us to liability
for past sales
and
cause our future sales to decrease.
We could be subject to additional income tax liabilities.
Our supplier relationships subject us to
a number of risks.
We may be subject to
risks related to government contracts
and related procurement regulations.
We may be subject to
product liability claims
if people or property are harmed
by the products
we sell.
We are subject to payments-related risks.
We could be liable
for breaches
of security.
We could be liable
for fraudulent or unlawful activities
of sellers.
[from Amazon.com’s 2010 Annual Report (PDF)]
The Economic Complexity Observatory
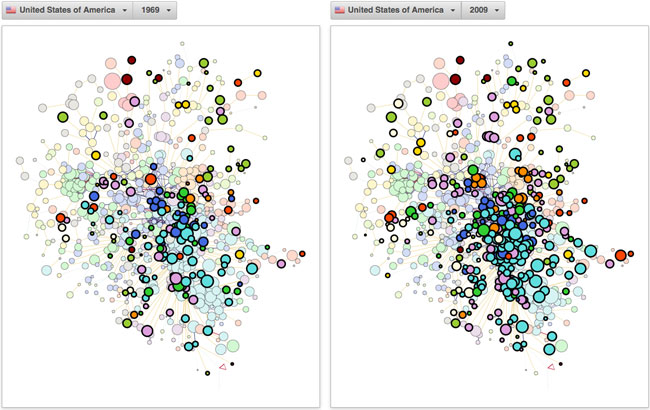
Your assignment:Â Write an essay on the changes in the United States economy between 1969 and 2009 using only this visualization.
Though the official launch is still months away, the Economic Complexity Observatory seems like it is already well on its way to living up to its bad-ass name. Don’t miss the interesting reading material.
What Shopping Cart?
The Self-Employed: Same As It Ever Was?
According to the Bureau of Economic Analysis, the self-employed consist of “active proprietors or partners who devote a majority of their working hours to their unincorporated businesses.” Another thing the BEA says is that, despite the civilian labor force tripling during the same period, the number of self-employed persons in the United States has remained fairly constant over the last 80 years.
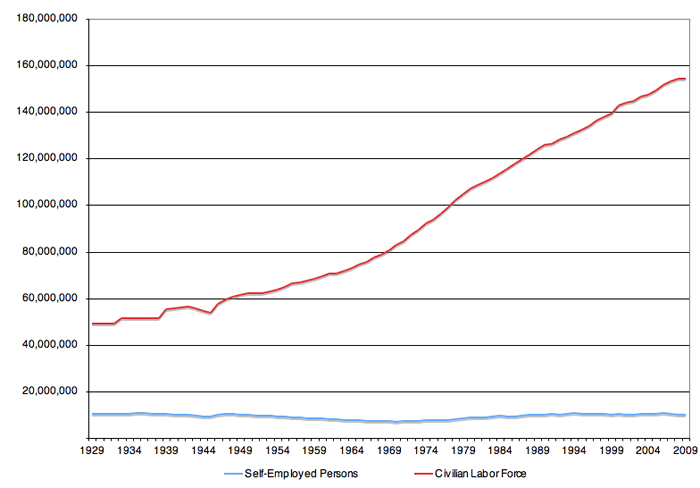
The only thing that has changed is industry composition…
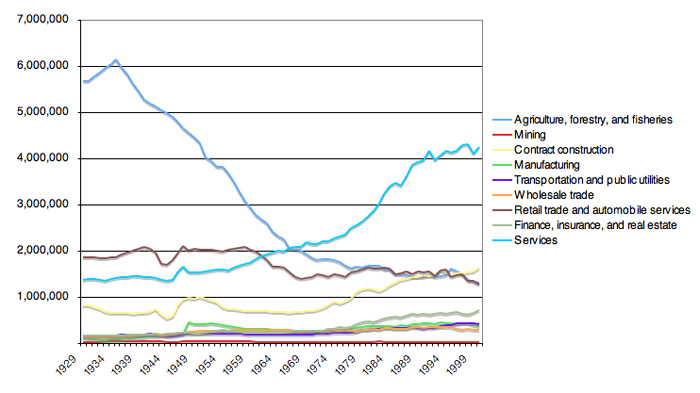 Where we once had farmers, we now have service providers. But does that explain why the self-employed went from 21% the size of the labor force down to 6%? Do we have fewer independent operators in the economy or are more of them turning to the corporate or LLC structure to protect themselves from the modern consumer?
[Self-Employment data via BEA NIPA Tables 6.7A-D; Civilian Labor Force figures from ERP B-35]
Dear Target Shoppers,
If your dog spills this much water on the floor, please consider using a rag. You might find you don’t need an 8-pack of paper towels anymore.
And seriously Target, out of every item in your store, you want to tell us about the paper towels?
2007 U.S. GDP in Pie-Vision!
Five days a week (or more), millions of Americans leave their homes to go to “work”. What does it all add up to? Gross Domestic Product, the sum of all final goods and services.
Below, we have the United States’ $14.1 trillion GDP from 2007, which means you are also looking at the output from the largest economy on Earth that year.
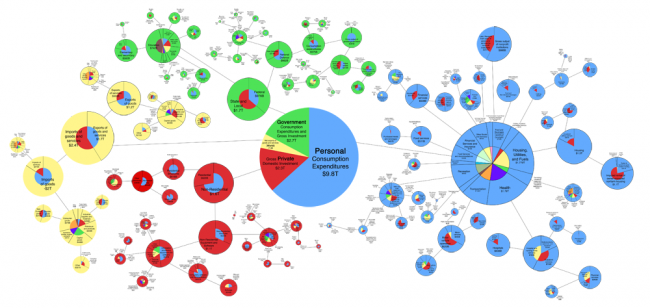 (click image to explore – (it’s a large file, so give it a second))
What do you see? For those game to squeeze their mind grapes, please put any thoughts or questions in the comments to guide future research. This is only the beginning of digging into GDP…


