The Future of the Fad

Believe it or not, it’s 2012 and there will supposedly be some flying cars around by the end of it.  Driverless cars are around the corner too, as are legions of robots.  It’s the future, kinda.  There’s so much in the works these days it’s difficult to discern what is actually happening and what is just California dreamin’.

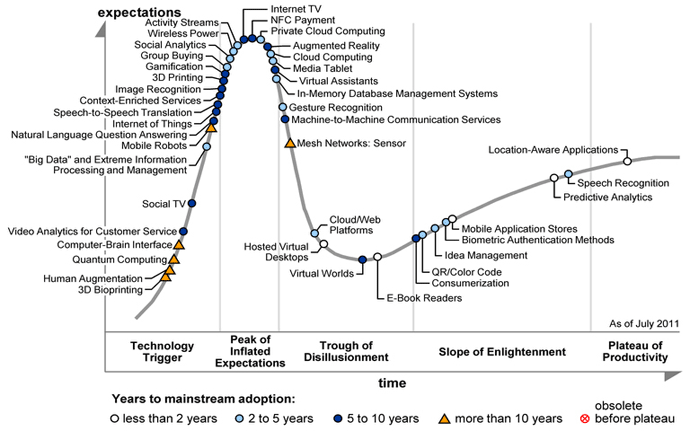
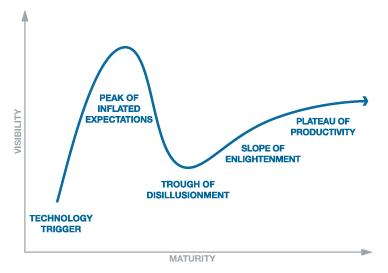
If you’re having trouble keeping up, perhaps the Gartner Hype Cycle can help.

To break it down in terms of the news you are used to hearing about new technology, check out the more detailed explanation.

While Gartner gets far more specific about particular industries with its paying clients, once a year they release the Hype Cycle for Emerging Technologies, evaluating the maturity of the entire field of next big things…

Happy trails to all on the road to the Plateau of Productivity…

[All charts from Gartner]

Making Lemonade from an Old and Somewhat Flawed Chart

Yesterday it was a map, today it’s a chart.

The point of this one is to say that, to be part of the world’s richest 1%, all you have to do is make $34,900 a year, after taxes.

That’s per person by household, of course, so if you’ve got a significant other, double it, and if you’ve got a couple of kids, quadruple it.  It raises the bar a bit, but the big shocker is: 29 million, or almost half, of the world’s richest 1% are Americans, just like you!

Then there’s some other countries, take a look…
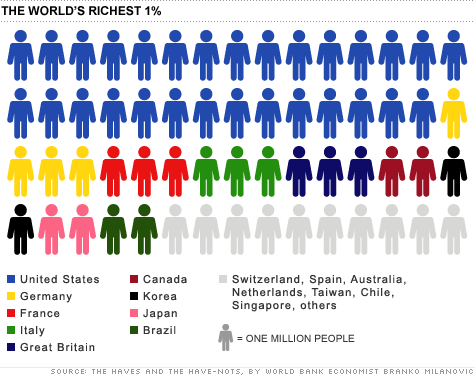
Now, this chart was part of an article on CNNMoney only a month ago, but we are told the data is from 2005.  Then you count the little chart people, find only 60, and rightly exclaim, “Hey, we hit 6 billion in 1999.”  For 2005, this chart would need four or five more people depending on which way you round it.  It might not seem like much or that long of a time, but world GDP went from $40B to $60B in the same period.  The question is, how would it change our $34,900 number?

But say you do top that number, then look around your surroundings and rightly exclaim, “Hey, I’m not rich.”  Just read the end of the article, silly.  We’re talking about the entire world here.  The world in which the global median income is $1,225/year. “In the grand scheme of things, even the poorest 5% of Americans are better off financially than two thirds of the entire world.”  …  That’s where the record skips.  If you want to hear some reactions to this conclusion, check out the 1,000+ comments that have piled up.  They range from pointing out the differences in cost of living around the world to accusing the writer of trying to take the heat off America’s 1%.

The disconnect is from measuring richness by income, as opposed to wealth.  Yes, remember wealth.  That’s what you’re missing.  Assets.  Your life should make sense again as soon as you hear that it takes $500,000 of assets to put you into the richest 1% worldwide.

How many little chart people would the U.S. get in this scenario?  37%, or 22 people.  The chart above was only off by 11%, but it completely missed the boat on Japan, which should have 16 people.  Anyway, what about the American 1%?  How much yearly income does it take to get in that club?  Well if you believe CNNMoney, they say it was $343, 927 in 2009, a measly 10 times what they were selling last month.

And before you think they might be trying to show both sides, note that this second article starts out by baiting you with the idea that it would take a million dollar income to be in the top 1%.  Surprise, you only need a third of a million!   Or, 37 times what the poorest 20% of Americans make on average, 14 times the next, 7.7 times the middle, and 4 times the fourth quintile.

As ThinkProgress would love to explain further, the American 1% owns 40% of the nation’s wealth, including 50% of all U.S. stocks, bonds and mutual funds, and takes home 24% of the nation’s income.

When it comes to world wealth, it looks a lot like yesterday’s map.
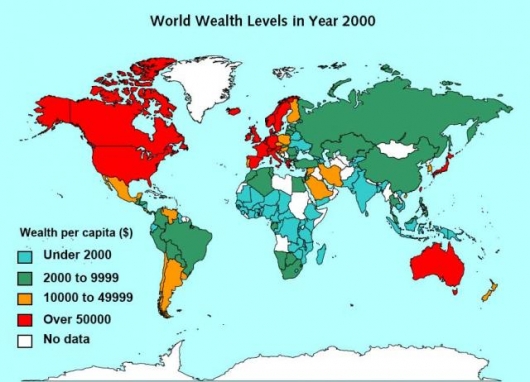
And back where we started, the crowd walks away wondering what it was all about anyhow.

[Map from World Institute for Development Economics Research via Gizmag]
BFFs: A Look Through the Fannie Maze

In 2008, two institutions with profoundly unfortunate names were taken over by the federal government.  Known as Fannie Mae and Freddie Mac, they owned or guaranteed half of the entire U.S. mortgage market at the time and their subsequent rescue represented “one of the most sweeping government interventions in private financial markets”… “in decades”.

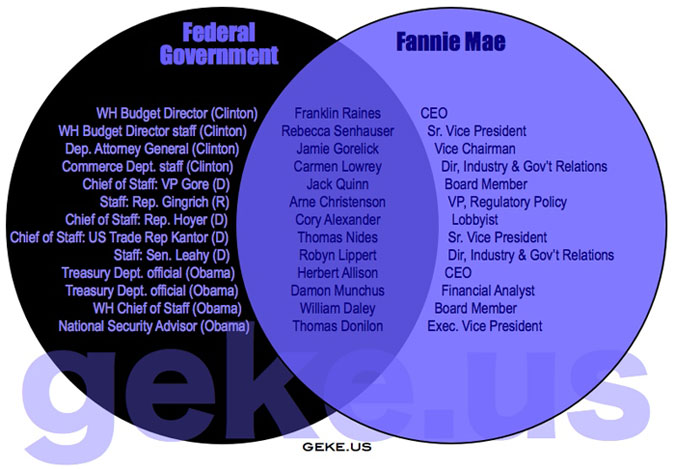
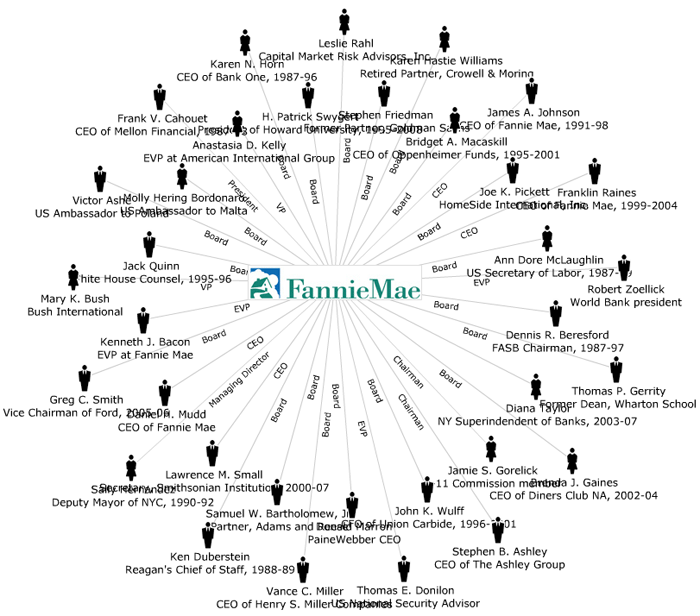
Who were the captains of this Titanic?  Who let them behind the wheel?  Though not the most glamorous of posts, as government-sponsored enterprises, they were unsurprisingly stocked with people who were in the government.  Below we have a venn diagram (one from a larger set created by geke.us) showing a selection of people from both sides of the fence equation.

(click for venn diagram collection)

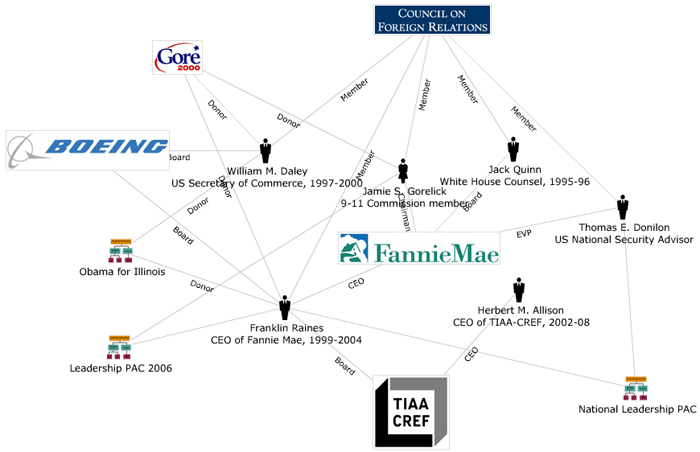
That’s the tip of the iceberg though.  Let’s see who on this list comes up in the NNDB Mapper, a very fun tool for mapping the links between people, companies and events ranging from Rihanna to the Funeral of Richard Nixon.

(click for NNDB interactive version)

Okay, we got 6 out of 13.  Above we have the connections they share.  Now let’s look at everyone associated with Fannie Mae.

(click for NNDB interactive version)

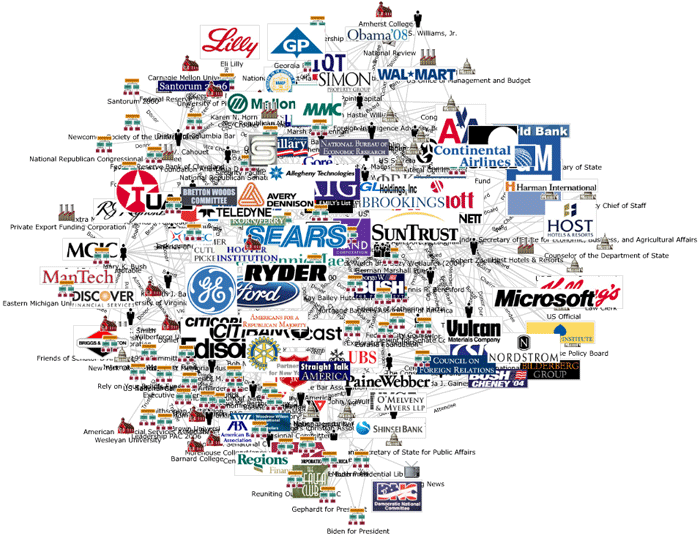
Mainly board members and CEOs.  But what happens if we blow out all of their nodes?

(click for NNDB interactive version)

We get a picture.  A picture of the myriad influences and connections that led to a spectacular failure.

The End.

[Venn diagram via Infoplasm]

Christmas in China (or It’s All a Blur of Red and Green)

China’s color might be red, but the only reason you hear it mentioned so often these days is because of the green.  For all the talk of China though, what do you really know about the country?  …  Aside from the population, censorship, poor working conditions and growing unrest.

This is obviously a gigantic topic, so we’ll begin by pulling together a few pieces regarding its political structure and leadership:

We start, complexly enough, with a nation of 1.3 billion people.  How many are in the Party?  80 million, or a little over 6% of the population.  (For comparison, Buddhists are estimated to include 50-80% of the populace, with Taoists around 30%.)  What are the perks of being a card carrying member?  Better jobs, better schools, and better …  wait for it… information!

As the BBC’s chart below shows us, that 80 million boils down very quickly to the 23 men and 1 woman who make up the Politburo, though they go on to say that the real power lies with the 9 members of the standing committee within it.


(click for BBC feature)

The BBC gives summaries on each segment, but the highlights include a National People’s Congress that only meets once a year, party elders who don’t go away, and the State Council, which “sits at the top of a complex bureaucracy of commissions and ministries and is responsible for making sure party policy gets implemented from the national to the local level.”

Or perhaps your eye was drawn to the Discipline Commission, originally established as the Central Control Commission and now officially known as the Central Commission for Discipline Inspection.  Charged with rooting out corruption in the party, you can decide for yourself whether you want to be the fifth person to like them on Facebook.

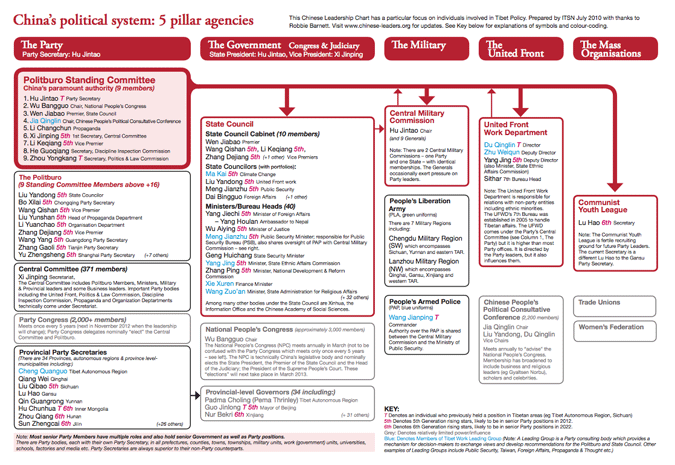
From there, we go to the names behind all these political bodies via a chart from The International Tibet Network:

(click to enlarge)

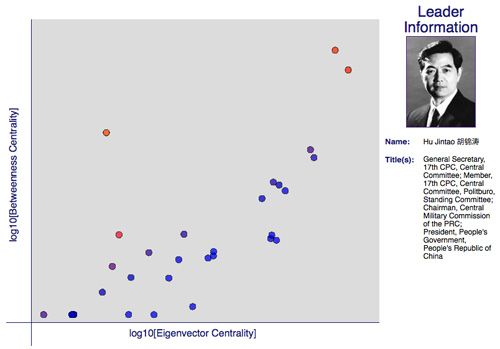
Don’t recognize many names?  Then try out Drew Conway’s interactive chart below, showing the most connected and critical members of China’s top brass going into 2012.

(click for interactive chart)

This year the fifth generation of Chinese leadership is expected to transition into power, with Xi Jinping likely to replace Hu Jintao as General Secretary and President.  While the fifth will be preoccupied with China’s economy, it is speculated that the sixth generation, born in the 1960’s, will be the source of significant political reform after their rise to power in 2022.

As for all the green, the Wall Street Journal is keeping score here: China Econtracker

[Charts from the BBC’s How China is Ruled, The International Tibet Network’s Chinese-Leaders.org, and Zero Intelligence Agents]

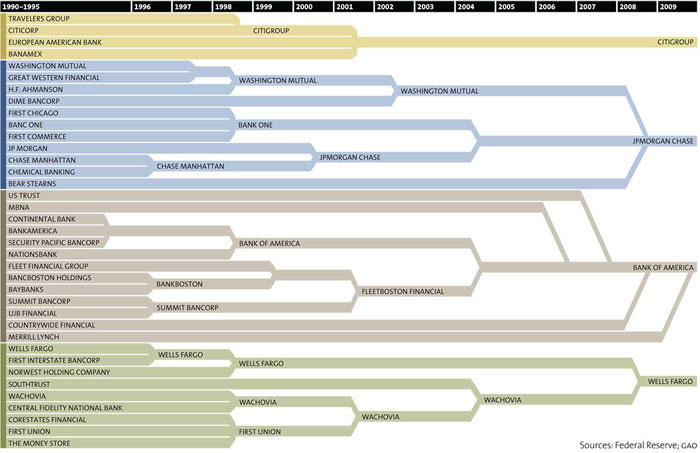
Hungry, Hungry Hippos (or Banking Mergers 1990-2009)

From Mother Jones:

The nation’s 10 largest financial institutions hold 54 percent of our total financial assets; in 1990, they held 20 percent. In the meantime, the number of banks has dropped from more than 12,500 to about 8,000. Some major mergers and acquisitions over the past 20 years:

big-bank-theory-chart-small(click to enlarge)

It might look like a sports bracket, but competition requires competitors and 33 of these players aren’t coming back next season.  The object is to best other companies, not eat them.

For a similar look at the investment banking game, see the New York Times’ Wall Street Vanishing Act chart.

[Chart from Mother Jones via /r/Economy]

It’s Never Enough

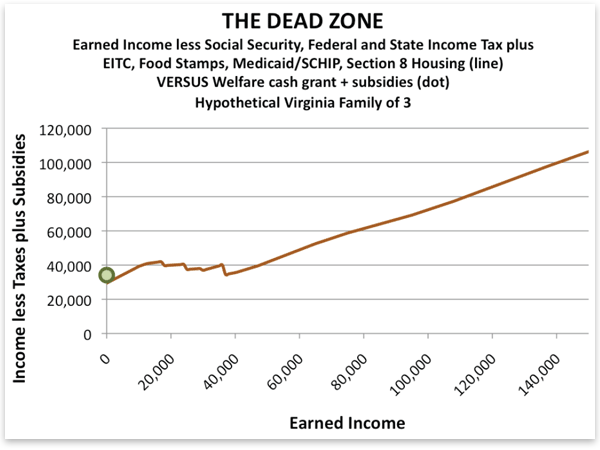
When one’s income increases, the tendency would be to expect standard of living to go with it.  In the following example, however, once you’re making $10,000 a year, you might feel just as poor making $40,000.

The issue is the balance of subsides and taxes on the lower income brackets.  The stagnation comes from the loss of social benefits as income rises.  Food stamps turn into grocery bills.  Free health insurance turns into… costly health insurance.

One way of looking at the situation, and the one taken by the Mises Institute, which made the chart above, is to say that by helping the poor, we are taking away the motivation to work.  And sure, when you find out low-wage work might leave you with less money than being unemployed, where is the motivation?  But, what’s the problem here: the helping of the poor or millions of full-time jobs that don’t pay enough to make ends meet?  Ape Con Myth’s take on the chart is that the base cost of life for hypothetical families of three in Virginia is about $40k.

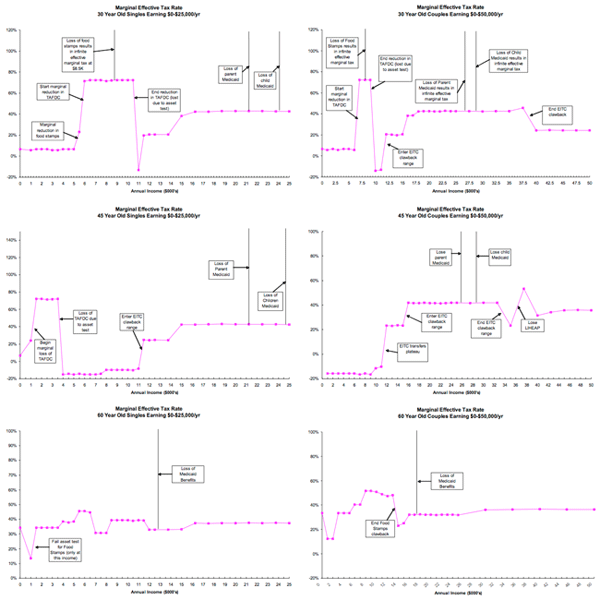
But that’s Virginia.  What about the country as a whole?  Below we have similar charts based on singles and couples at ages 30, 45 and 60 from a Boston University/National Bureau of Economic Research report.  Don’t worry about the fine print.  Just notice how different they all are…

(click to enlarge)

As the researchers were quick to point out, “the patterns by age and income of marginal net tax rates on earnings, marginal net tax rates on saving, and tax-arbitrage opportunities can be summarized with one word – bizarre.”

What do they think of our chances of understanding the elements at work?  “Thanks to the incredible complexity of the U.S. fiscal system, it’s impossible for anyone to understand her incentive to work, save, or contribute to retirement accounts absent highly advanced computer technology and software.”

Try doing that on a computer at a library.

[Mises chart and NBER report via Greg Mankiw via Kottke]

The 2-to-1 Funny Chart/Unfunny Chart Friday Special

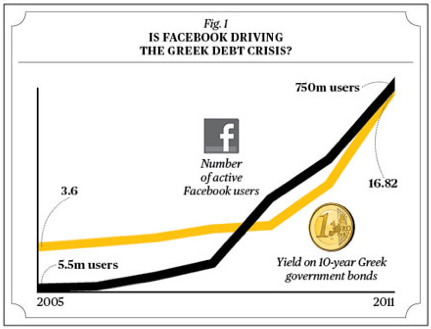
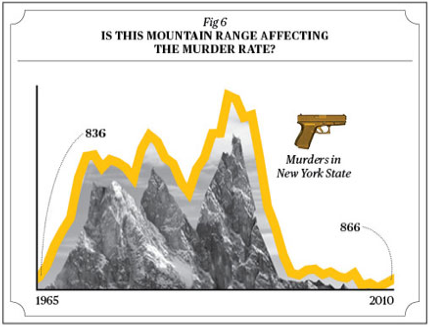
First we have a couple of samples from a Businessweek feature on the ease of using charts and data to say whatever you want.

Just because some numbers line up doesn’t make it meaningful.  Yet to look at it, say skimming this page and only looking at the charts, you might wonder why Facebook has to be such a bully.  Who knows what drives the yield on government bonds in the first place?  Oil, debt, Facebook, it’s usually one of the three.

In the case of the mountain though, perhaps it would be best to leave this one alone.

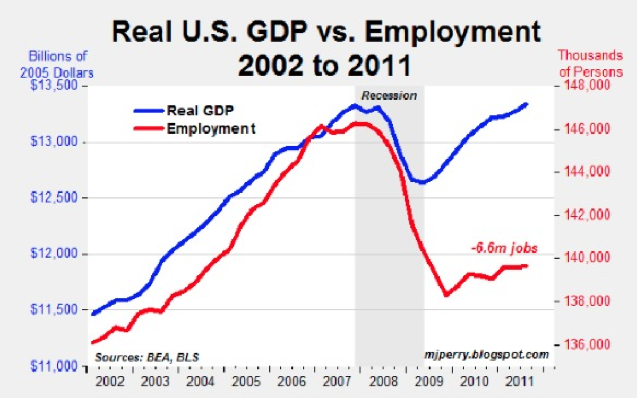
That, of course, leaves us with the unfunny.  Lines that moved together until one slipped and the other failed to notice…

Sadly, this last chart tells us something.  Namely, that the economy doesn’t really care about 6.6 million of us no longer having jobs.

Have a great weekend!

[Final chart via The Atlantic‘s Most Important Graphs of 2011]

Adolescent Issues (or A Note to Congress)

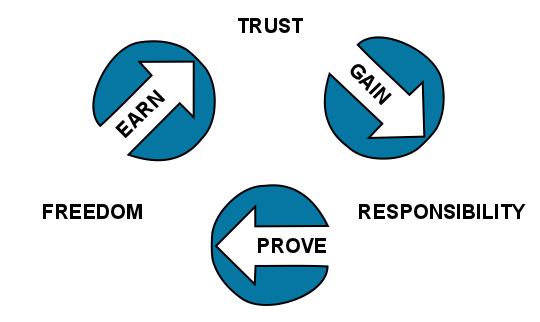
The following chart was sent in by a younger reader as a life hack for teenagers seeking more freedom.  It’s logic parents will have a difficult time fending off.

Is it the same for adults?  The earning of trust and taking on of responsibility are continual processes in all aspects of our life.  They form the basis of all our relationships.  But as adults, are we still proving our freedom?

Following laws keeps us out of jail.  Following requirements keeps our job.  Following etiquette keeps our friends.  Our freedom is never quite complete as the conventions of society create boundaries that we are free to cross, but only at a price. We prove our freedom to live within the context laid out by our community through maintaining the trust.

For the trust to be preserved, our responsibilities must be managed in the spirit of what earned the trust in the first place.  This is how perceived value is made real.  The follow-through is the proof, and perhaps as such our freedom.

…  Seems like this should have been sent to Congress too.  They don’t seem to understand the last step and endanger our freedom in the process.

[Guest chart from Mars]

Tonight We’re Not Going To Party Like It’s…

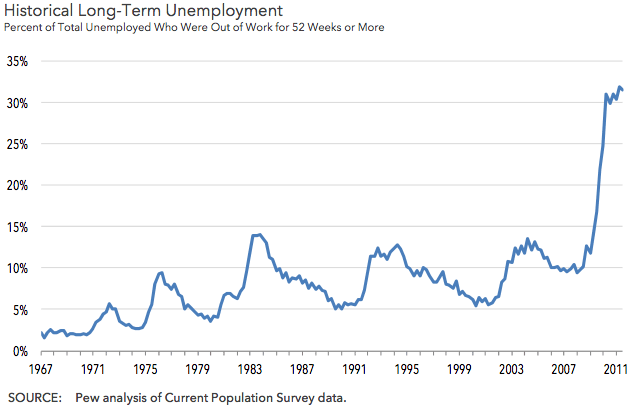
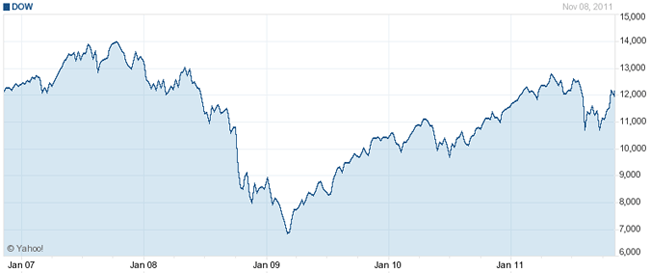
Notice the big change since 2007?

That’s over 4 million people jobless for a year or more as of the Q3 2011.

Yet the Dow thinks it’s 2007.

Here’s to keeping expenses low and profits high!

[Unemployment data (PDF) from Pew Charitable Trusts via Infectious Greed, Dow chart from Yahoo!]

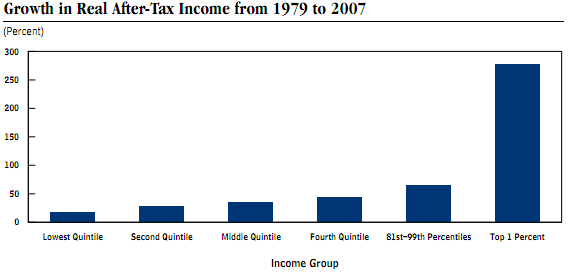
“Growth” in “Real” After-Tax Income

The Economist gave a nod to the 99% by way of some numbers from the Congressional Budget Office that make you go, “Ouch.”  Those are some tough percentages to defend.


But how do you stop it from being easier to make a lot of money when you have a lot of money?

[graph from the CBO’s Trends in the Distribution of Household Income Between 1979 and 2007 (PDF)]

1 2 3 4 5