Now we are going back through the sub-sectors to add in GDP and some starter Economic Census data…
 (click to enlarge)
The Struggle for Survival is an Incredible Waste of Time
Now we are going back through the sub-sectors to add in GDP and some starter Economic Census data…
(click to enlarge)
Here we go again, but this time all 20 economic sectors link to a first round mapping. Also, U.S. GDP figures have been added to the top level and will be trickling down over the next few weeks…
The chart below is live, or you can go to the full page version.
 |
 |
 |
 |
Expansion of initial charts…
 |
 |
(aka, Construction and Wholesale Trade)
 |
 |
Two more…
 |
 |
Two more charts for our NAICS collection. Click either image to explore…
 |
 |
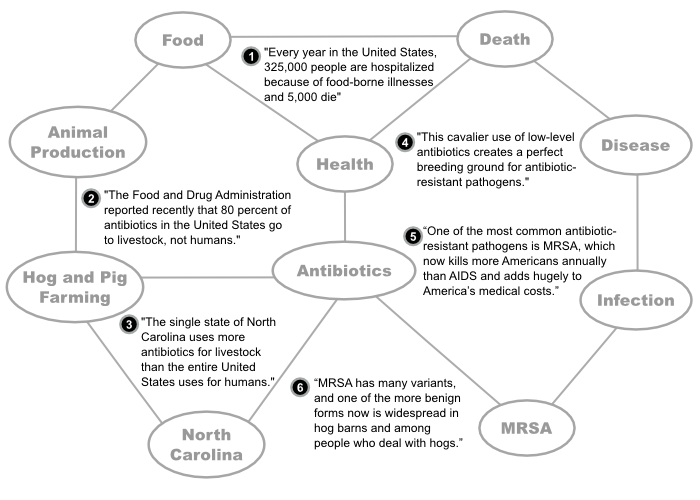
We have access to and consume more news and information than ever. But what are we taking from it all?
Is this knowledge adding up in any meaningful way or is it all merely washing over us?
Ape Con Myth wants to see what happens when you start adding it up. Of course, where does one begin with
such an endeavor, when a single New York Times op-ed piece can yield all of this and more:
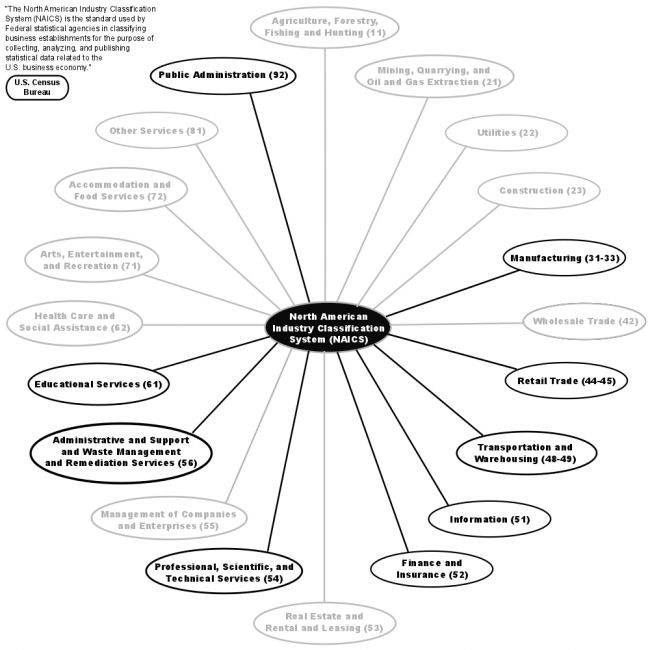
We’ve been looking at North American Industry Classification System for a while, but now we’ve got a system
that will be both scalable and interactive. Speaking of, click the image to see what has made it in so far.
Five days a week (or more), millions of Americans leave their homes to go to “work”. What does it all add up to? Gross Domestic Product, the sum of all final goods and services.
Below, we have the United States’ $14.1 trillion GDP from 2007, which means you are also looking at the output from the largest economy on Earth that year.
 (click image to explore – (it’s a large file, so give it a second))
What do you see? For those game to squeeze their mind grapes, please put any thoughts or questions in the comments to guide future research. This is only the beginning of digging into GDP…