Watch Out For Falling Giants

Economics Devision
Internal Memo
April 3, 2012

Re: Watch Out for Falling Giants

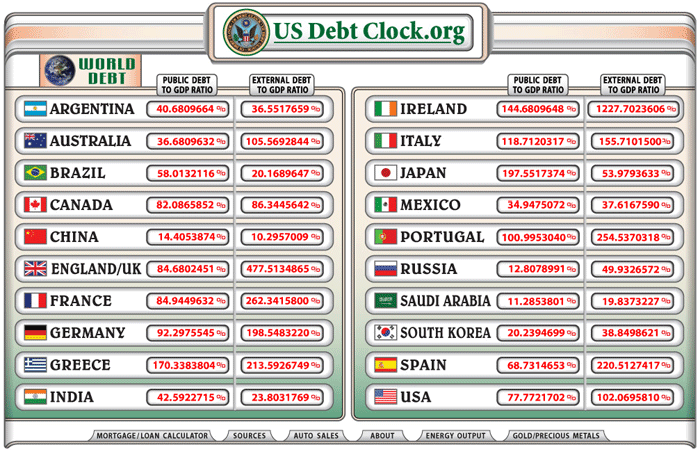
Did anyone notice this line-up in the Econ Devision feed the other day?

That’s quite a few large companies looking vulnerable.  Is the age of giants over and if so what might they be willing to do to keep from falling?  Whose interest will it be in?  How long can the inevitable be put off?  Where’s the line between big business and bloated bully?  Let’s keep our eyes out for more examples and any past highlights in the field of non-competitive overstaying of welcomes.

File under 00262 – The Behavior of Falling Giants

Untitled Minimum Wage Post

Every once in a while you run into a page on Wikipedia that never quite came together.  It’s not a stub, but it’s far from complete.  ‘Economic issues in the United States‘ is one such page.  The edits still trickle in, but the page remains adrift.  The section on Cost of living is a particularly interesting read, starting off in one direction only to have the wheels fall off at the end.


Minimum wage is one of those things, but why?  Because the economy is a murky pool where it is easy to make correlations and often impossible to prove anything, especially what any one value will do to everything else when changed.  It’s perfect for humans since it allows everyone to make their point, even if no one really knows what is happening.

As for the first part, yes, paying employees more is one possible thing that might lead a business to raise prices.  But so are gas prices and food prices and prices in general.  Prices don’t wait until their year-end review to find out if they got a bump.  They go up and down as they please, but mainly up because the only measure is more.  There’s always someone raising prices and therefore always someone to point at and blame for your prices going up too.  It makes sense that wages get a turn, unless you want everyone to max out their credit and lose their home.

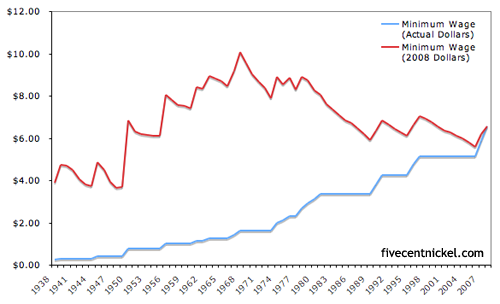
Now for that missing citation.  Would you say the minimum wage has not kept up with inflation over the past 30 years?

Almost, except for that first part there, the 80’s, where it didn’t at all and then the second part where it never caught up to the levels seen in the 60’s and 70’s.

The funny part though is how much drama surrounds the issue, once you start looking at the numbers.  Of the 139 million people employed in the civilian labor force in 2010, only 4.4 million (3%) were making at or below the minimum wage.  “Only 4.4M” because when the subject of minimum wage is brought up, you’d think the idea was to burn every business down.

Look closer and that 4.4M includes 2.1M workers aged 16-24 and 2.7M part-timers.  Look again and 2M work in leisure and hospitality (1.6M of that food services), 764K in retail and 425K in everyone’s favorite, education and health services.  Meanwhile, there’s all the cities and states that have set their own standards for living wages (some higher, some lower).

The federal minimum wage is a far more specific issue than it would seem and, apparently, what might be most at issue is the price of cheap, fast food.  If those kids didn’t make minimum wage, McDonald’s might cost as much as real food.  … Oh, never mind, it already costs more.  Two wrongs don’t make a right, but they can really turn out a profit.

In the end, if Wall Street can complain about their pay, everyone can.  (And perhaps they’re all right.)

It’s Not Just In Your Head

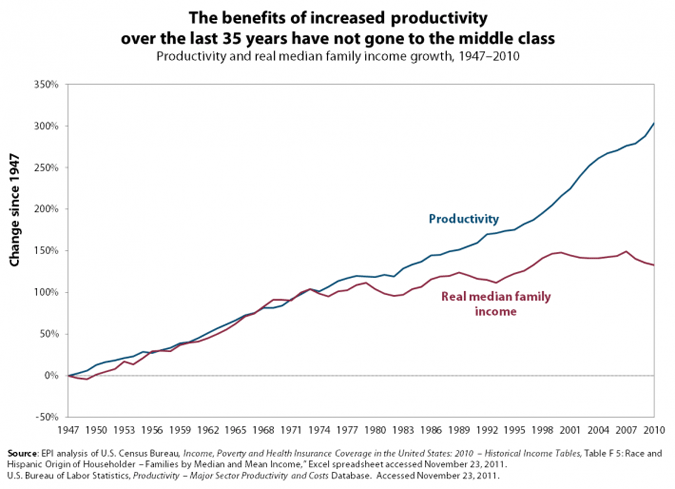
This one explains itself…

If you’re looking for more charts of the like, search no further than the Economic Policy Institute‘s The State of Working America.  The one above is from their Income & Poverty category, which brings together two things that are supposed to cancel each other out.

As long as employees are considered expenses, as opposed to, say, investments, they will continue to get squeezed rather than appreciated.

[State of Working America chart via zunguzunga]

Making Lemonade from an Old and Somewhat Flawed Chart

Yesterday it was a map, today it’s a chart.

The point of this one is to say that, to be part of the world’s richest 1%, all you have to do is make $34,900 a year, after taxes.

That’s per person by household, of course, so if you’ve got a significant other, double it, and if you’ve got a couple of kids, quadruple it.  It raises the bar a bit, but the big shocker is: 29 million, or almost half, of the world’s richest 1% are Americans, just like you!

Then there’s some other countries, take a look…
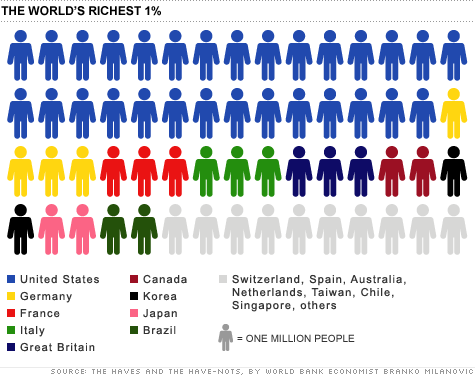
Now, this chart was part of an article on CNNMoney only a month ago, but we are told the data is from 2005.  Then you count the little chart people, find only 60, and rightly exclaim, “Hey, we hit 6 billion in 1999.”  For 2005, this chart would need four or five more people depending on which way you round it.  It might not seem like much or that long of a time, but world GDP went from $40B to $60B in the same period.  The question is, how would it change our $34,900 number?

But say you do top that number, then look around your surroundings and rightly exclaim, “Hey, I’m not rich.”  Just read the end of the article, silly.  We’re talking about the entire world here.  The world in which the global median income is $1,225/year. “In the grand scheme of things, even the poorest 5% of Americans are better off financially than two thirds of the entire world.”  …  That’s where the record skips.  If you want to hear some reactions to this conclusion, check out the 1,000+ comments that have piled up.  They range from pointing out the differences in cost of living around the world to accusing the writer of trying to take the heat off America’s 1%.

The disconnect is from measuring richness by income, as opposed to wealth.  Yes, remember wealth.  That’s what you’re missing.  Assets.  Your life should make sense again as soon as you hear that it takes $500,000 of assets to put you into the richest 1% worldwide.

How many little chart people would the U.S. get in this scenario?  37%, or 22 people.  The chart above was only off by 11%, but it completely missed the boat on Japan, which should have 16 people.  Anyway, what about the American 1%?  How much yearly income does it take to get in that club?  Well if you believe CNNMoney, they say it was $343, 927 in 2009, a measly 10 times what they were selling last month.

And before you think they might be trying to show both sides, note that this second article starts out by baiting you with the idea that it would take a million dollar income to be in the top 1%.  Surprise, you only need a third of a million!   Or, 37 times what the poorest 20% of Americans make on average, 14 times the next, 7.7 times the middle, and 4 times the fourth quintile.

As ThinkProgress would love to explain further, the American 1% owns 40% of the nation’s wealth, including 50% of all U.S. stocks, bonds and mutual funds, and takes home 24% of the nation’s income.

When it comes to world wealth, it looks a lot like yesterday’s map.
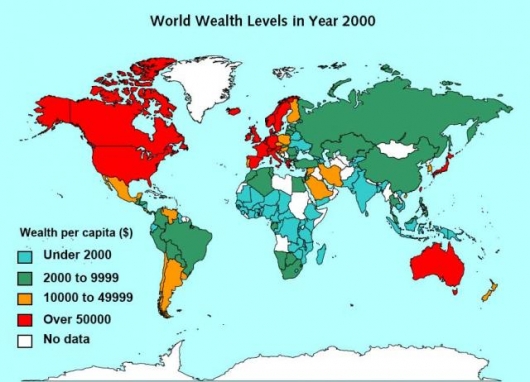
And back where we started, the crowd walks away wondering what it was all about anyhow.

[Map from World Institute for Development Economics Research via Gizmag]

Making Lemonade from an Old and Somewhat Flawed Map

We begin with a map.  A map from TD-Architects, which seems to have a lot of interesting content though remarkably difficult navigation.  A map that might be from 2006 or 2007 (or 2009?).  The source of the income data?  Unknown.

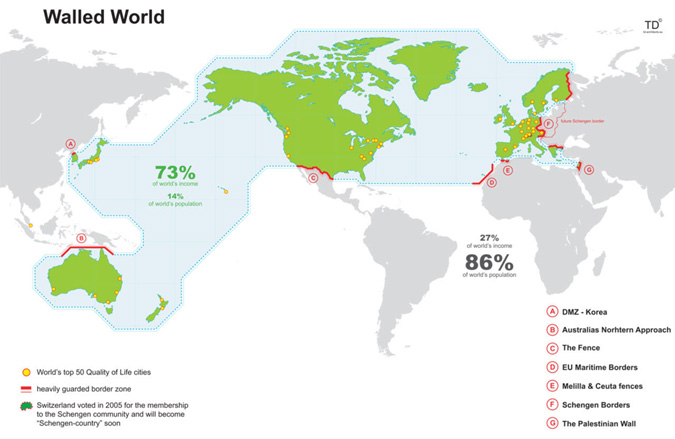
Anyway, the idea of the map is that 73% of the world’s income is being protected on all sides by walls or, as they are called, “heavily guarded border zones” in an effort to create the “greatest wall” ever built on this planet.  Go ahead, take a look…

(click to enlarge)

If you want get into the flaws of the map, reddit has conveniently ripped it apart on multiple occasions, including this 400+ comment thread.  The gist is that “heavily guarded” is an exaggeration, the selections are arbitrary, and there are plenty of wealthy areas outside these borders.  …  But is it still conceptually interesting?

While looking into the income data, it turned out that these countries within the so-called walled world match up with the World Bank‘s list of “High Income” members of the Organisation for Economic Co-operation and Development (OECD).  Since 1973, these countries have made 70-80% of the world’s income year after year, that is until 2006 when their percentage started to drop.  The situation really is changing, and as of 2010 the high income OCEDers were down to 63%, but the map really is a SNapshot Of Globalization, which is what TD’s SNOGs are all about.

Tomorrow we’ll use a somewhat flawed chart to take this a step further.

For more on those walls: DMZ, Australian Defense Force, Mexico-United States barrier, EU Maritime Borders, Melilla & Ceuta border fences, Schengen Area, Israeli West Bank barrier.

For more on the data: The World Bank is offering a killer 200,000+ line spreadsheet full of all kinds of data or if you’re more of a charts person, check it out via Google’s Public Data Explorer.

[Map via Information is Beautiful]

What’s Your Line, Brother?

From Daniel ClowesWilson:

Some Ivy League students are starting to agree with the sentiment after watching so many of their peers head off to work in consulting and finance after graduation.  From All Things Considered’s Stopping the ‘Brain Drain’ of the U.S. Economy

Student protesters recently got into a Goldman Sachs recruitment session at Princeton University to tell student attendees they were listening to a “carefully crafted recruitment pitch” and that they could “do better for society.” Similar protests have been held at Harvard University, and at Stanford University, where Teryn Norris was a student. …

“The problem is that when you’ve got 20 to 30 percent of some of the top talent in this country going into a sector that is not necessarily contributing to economic and social productivity,” he says. “That’s a problem for the country at large and it’s something that we should all be concerned about.”

Economist Paul Kedrosky agrees, except that we’re about two decades late in getting concerned.  He believes the current financial morass is the work of a long line of bright minds who decided to spin their wheels in the name of money, as opposed to areas like science, engineering and mathematics, a.k.a. the subjects many of them actually studied in school…

[Wilson is available from Drawn & Quarterly; NPR story via Hacker News]

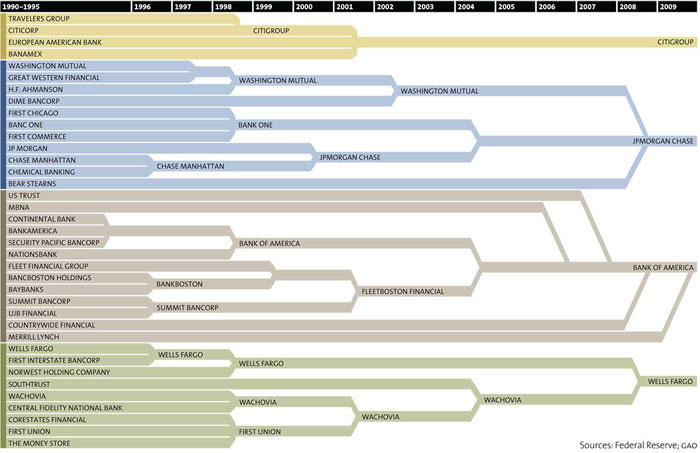
Hungry, Hungry Hippos (or Banking Mergers 1990-2009)

From Mother Jones:

The nation’s 10 largest financial institutions hold 54 percent of our total financial assets; in 1990, they held 20 percent. In the meantime, the number of banks has dropped from more than 12,500 to about 8,000. Some major mergers and acquisitions over the past 20 years:

big-bank-theory-chart-small(click to enlarge)

It might look like a sports bracket, but competition requires competitors and 33 of these players aren’t coming back next season.  The object is to best other companies, not eat them.

For a similar look at the investment banking game, see the New York Times’ Wall Street Vanishing Act chart.

[Chart from Mother Jones via /r/Economy]

It’s Never Enough

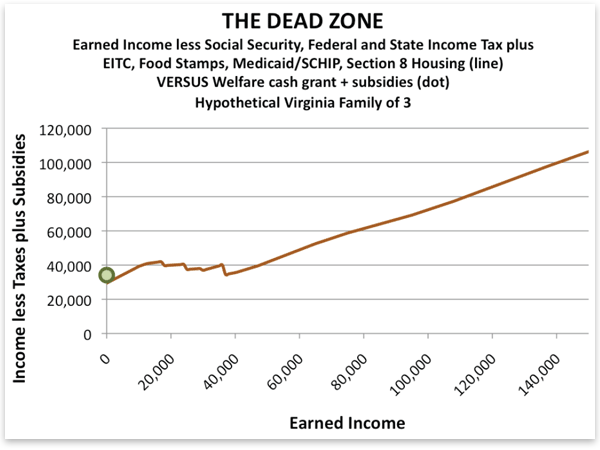
When one’s income increases, the tendency would be to expect standard of living to go with it.  In the following example, however, once you’re making $10,000 a year, you might feel just as poor making $40,000.

The issue is the balance of subsides and taxes on the lower income brackets.  The stagnation comes from the loss of social benefits as income rises.  Food stamps turn into grocery bills.  Free health insurance turns into… costly health insurance.

One way of looking at the situation, and the one taken by the Mises Institute, which made the chart above, is to say that by helping the poor, we are taking away the motivation to work.  And sure, when you find out low-wage work might leave you with less money than being unemployed, where is the motivation?  But, what’s the problem here: the helping of the poor or millions of full-time jobs that don’t pay enough to make ends meet?  Ape Con Myth’s take on the chart is that the base cost of life for hypothetical families of three in Virginia is about $40k.

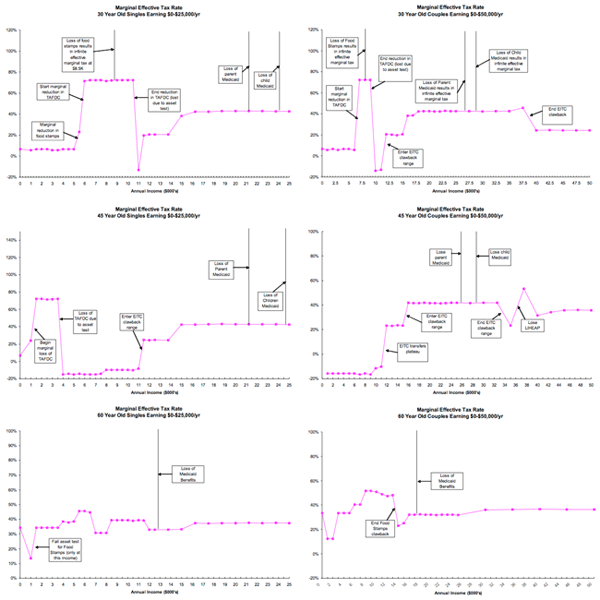
But that’s Virginia.  What about the country as a whole?  Below we have similar charts based on singles and couples at ages 30, 45 and 60 from a Boston University/National Bureau of Economic Research report.  Don’t worry about the fine print.  Just notice how different they all are…

(click to enlarge)

As the researchers were quick to point out, “the patterns by age and income of marginal net tax rates on earnings, marginal net tax rates on saving, and tax-arbitrage opportunities can be summarized with one word – bizarre.”

What do they think of our chances of understanding the elements at work?  “Thanks to the incredible complexity of the U.S. fiscal system, it’s impossible for anyone to understand her incentive to work, save, or contribute to retirement accounts absent highly advanced computer technology and software.”

Try doing that on a computer at a library.

[Mises chart and NBER report via Greg Mankiw via Kottke]

The Illusion of Choice for a New Generation

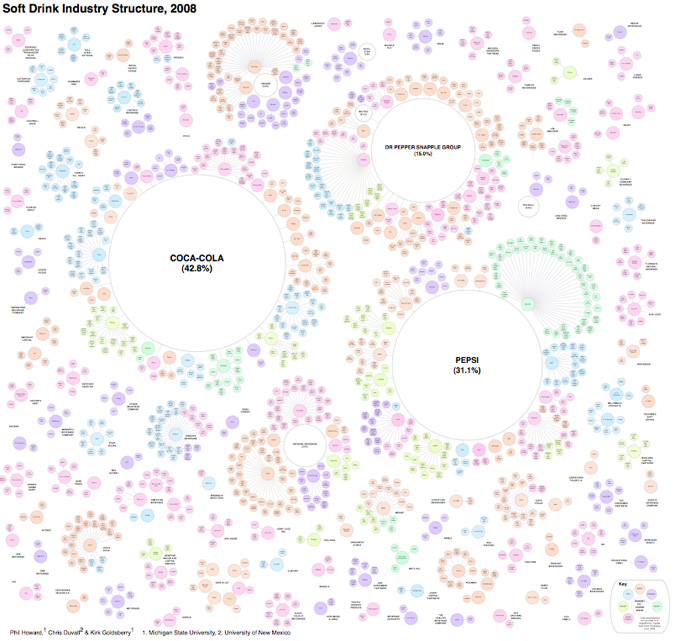
The formula for soft drinks is pretty simple, which might explain why there are so many of them on the market.  Water + a Sweetener + a Flavoring Agent = Good Margins.  Add in caffeine and fruit juice as needed.

The following chart, however, is called The Illusion of Diversity for a reason.

(click to zoom in)

It’s generally known that Coke and Pepsi are a big part of the industry, but what isn’t clear from all the choices above is that, along with the Dr. Pepper Snapple Group, the top three firms account for 89% of soft drink sales in the United States.

[via Visual Complexity] [more food and beverage-related infographics from Philip H. Howard at Michigan State University]
1 2 3 4 5 6 11