(click to enlarge)
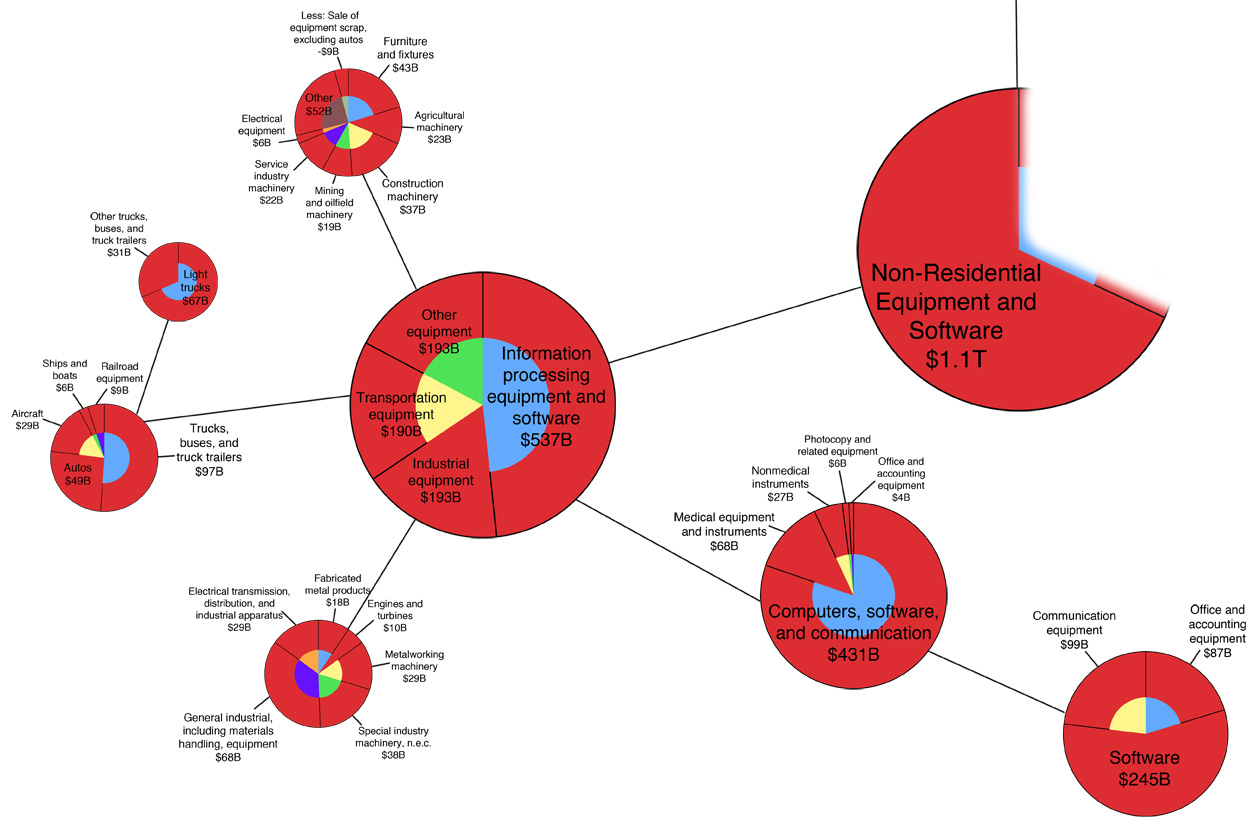
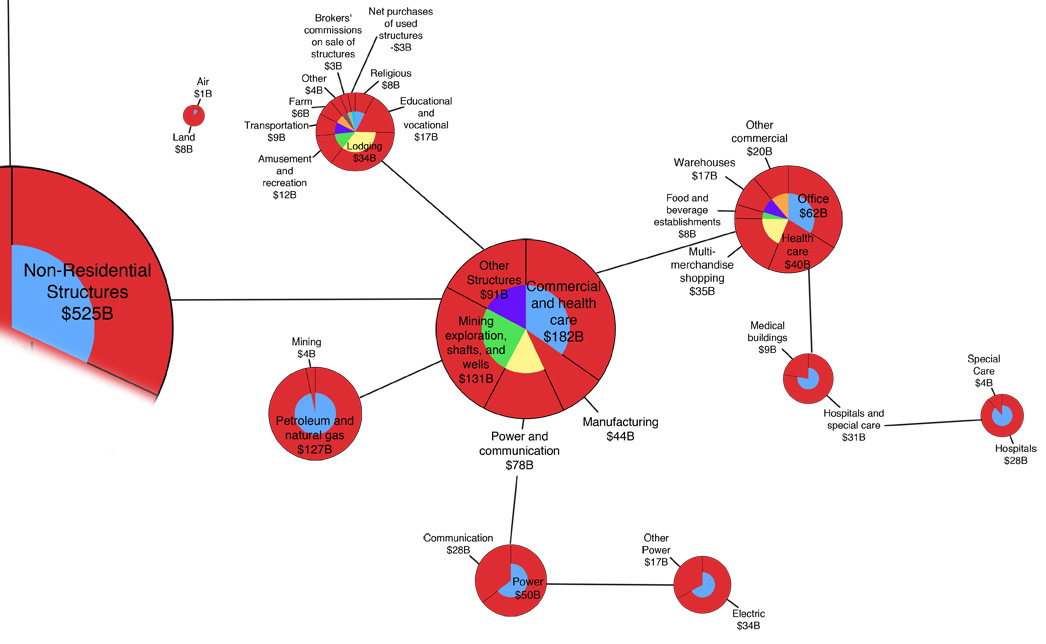
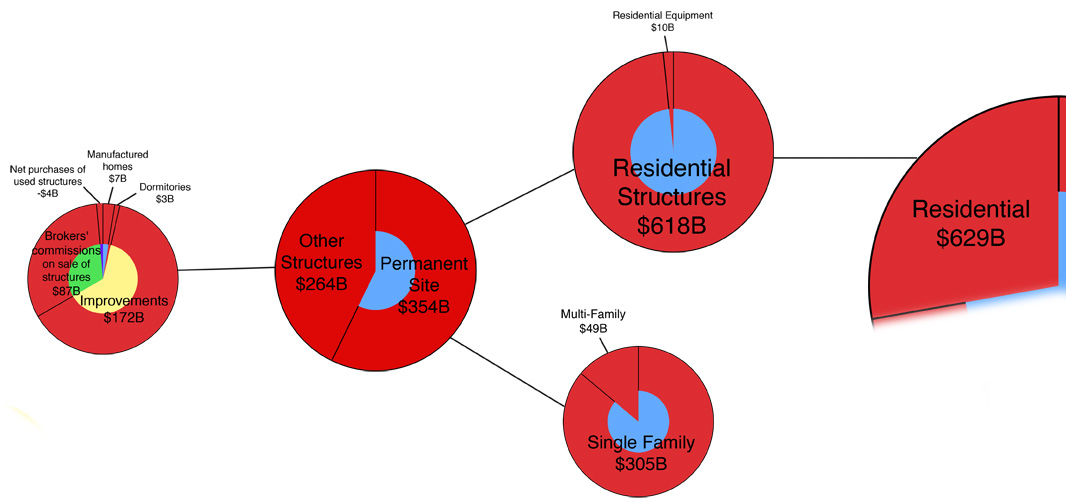
[2007 US GDP – Data Source: BEA – NIPA tables 3.9.5, 3.11.5, 3.15.5]
With Silicon Valley and Hollywood in the deck, you’d hope California’s GDP would be more fun. Â But then you look and the largest industry is Real Estate and Renting and Leasing, i.e. paying to occupy existing structures. Â … Â I guess we have a very loose definition of economic output.
(You can switch Label and Color to get the second graph, but it’s nice to have them both going at once.)
For a refresher on economic sectors, check out the posts from 00019 – NAICS.
[Data via Bureau of Economic Analysis, Graphs made via Many Eyes]
In California, the real money is in the country…
 (click to enlarge)
[Population data via U.S. Census Bureau: State Pop, Metro Pop]
[GDP data via Bureau of Economic Analysis: State GDP, Metro GDP]
“BEA’s economic areas define the relevant regional markets surrounding metropolitan or micropolitan statistical areas. They consist of one or more economic nodes – metropolitan or micropolitan statistical areas that serve as regional centers of economic activity – and the surrounding counties that are economically related to the nodes.”
 (click for BEA’s enlarged version)
Annual income data by area for 1979-2008 can be found through the BEA’s interactive Bearfacts map.
[Map via Bureau of Economic Analysis]