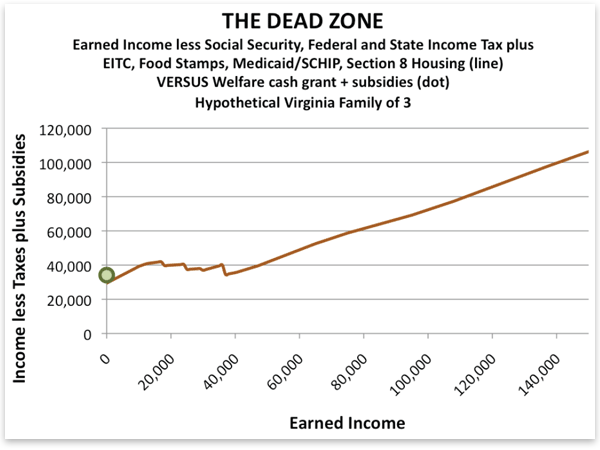
When one’s income increases, the tendency would be to expect standard of living to go with it. In the following example, however, once you’re making $10,000 a year, you might feel just as poor making $40,000.
The issue is the balance of subsides and taxes on the lower income brackets. The stagnation comes from the loss of social benefits as income rises. Food stamps turn into grocery bills. Free health insurance turns into… costly health insurance.
One way of looking at the situation, and the one taken by the Mises Institute, which made the chart above, is to say that by helping the poor, we are taking away the motivation to work. And sure, when you find out low-wage work might leave you with less money than being unemployed, where is the motivation? But, what’s the problem here: the helping of the poor or millions of full-time jobs that don’t pay enough to make ends meet? Ape Con Myth’s take on the chart is that the base cost of life for hypothetical families of three in Virginia is about $40k.
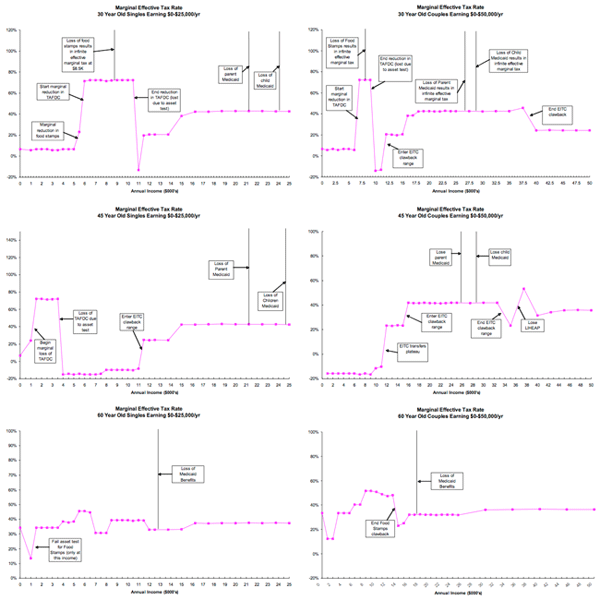
But that’s Virginia. What about the country as a whole? Below we have similar charts based on singles and couples at ages 30, 45 and 60 from a Boston University/National Bureau of Economic Research report. Don’t worry about the fine print. Just notice how different they all are…
As the researchers were quick to point out, “the patterns by age and income of marginal net tax rates on earnings, marginal net tax rates on saving, and tax-arbitrage opportunities can be summarized with one word – bizarre.”
What do they think of our chances of understanding the elements at work? “Thanks to the incredible complexity of the U.S. fiscal system, it’s impossible for anyone to understand her incentive to work, save, or contribute to retirement accounts absent highly advanced computer technology and software.”
Try doing that on a computer at a library.
[Mises chart and NBER report via Greg Mankiw via Kottke]


