• Portfolio
  • Archive
  • Portfolio
  • Archive

The Struggle for Survival is an Incredible Waste of Time

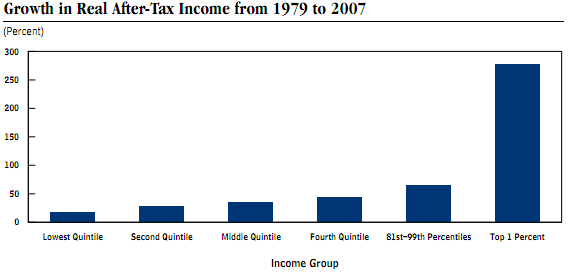
“Growth” in “Real” After-Tax Income

by The Economics Devision | posted in: External Charts, The Economics Devision | 0

The Economist gave a nod to the 99% by way of some numbers from the Congressional Budget Office that make you go, “Ouch.”  Those are some tough percentages to defend.

But how do you stop it from being easier to make a lot of money when you have a lot of money?

[graph from the CBO’s Trends in the Distribution of Household Income Between 1979 and 2007 (PDF)]

Share:

  • Click to share on X (Opens in new window) X
  • Click to share on Facebook (Opens in new window) Facebook
00039, 00222
Previous Post
Next Post

Similar Posts

You Can Jump Into The Fire
August 9, 2012

What is the creeping menace shown in the haunted chart below?  It’s the amount of...

Might or Might Not
July 5, 2011

This might or might not be a diagram for an autonomous “second layer” of the...

Federal Government – Non-Defense
March 28, 2011

(click to enlarge)

Communication, Recreation, Education…
January 31, 2011

(click to enlarge)

Government Consumption Expenditures and Gross Investment
March 14, 2011

(click to enlarge)

California Non-Farm Jobs by Area
March 17, 2011

(click to enlarge)

Money v0.3
February 17, 2011

(click for page)

Dear Target Shoppers,
May 4, 2011

If your dog spills this much water on the floor, please consider using a rag. ...

Check out the latest from the mind behind Ape Con Myth!

logo_ACM_clean190

logo_ACM_clean190

© 2025 Ape Con Myth - WordPress Theme by Kadence WP