  |
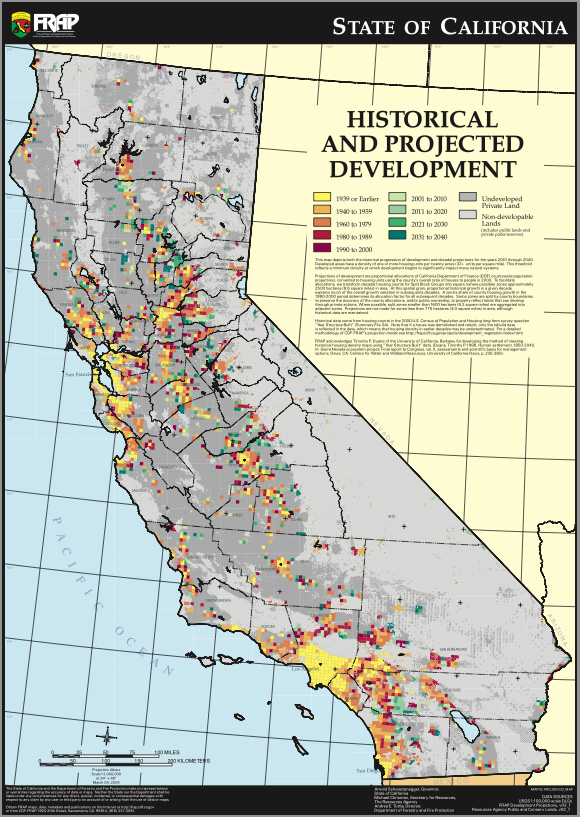  |
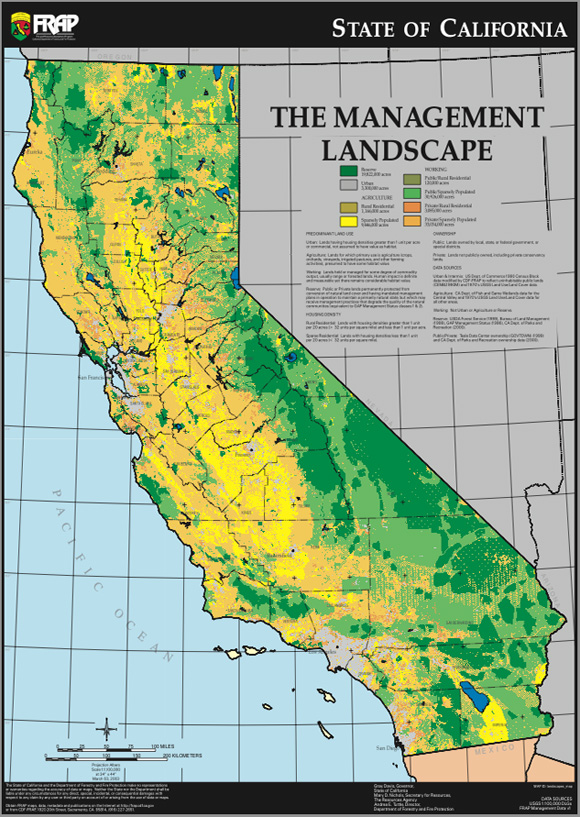
[Click on the maps to get a little closer or check out the full PDFs and more at FRAP maps]
|
|
[Click on the maps to get a little closer or check out the full PDFs and more at FRAP maps]
I want to be there.
 (click for slightly larger version)
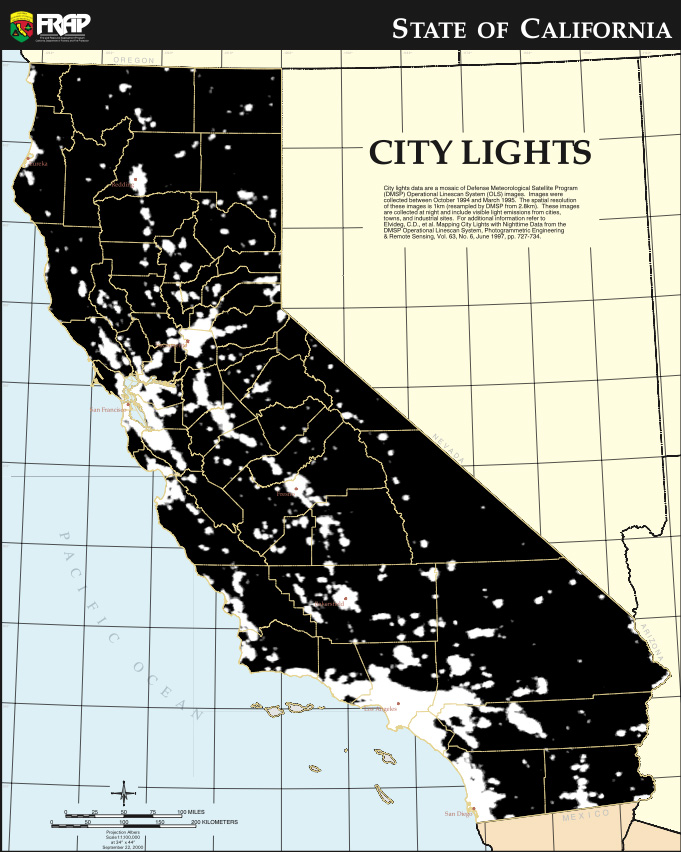
“City lights data are a mosaic of Defense Meteorological Satellite Program (DMSP) Operational Linescan System (OLS) images. These images were collected at night (10/1994-3/1995) and include visible light emissions from cities, towns, and industrial sites.”
[Full version available in the excellent FRAP Maps collection from the CA Department of Forestry and Fire Protection.]
For your reference…
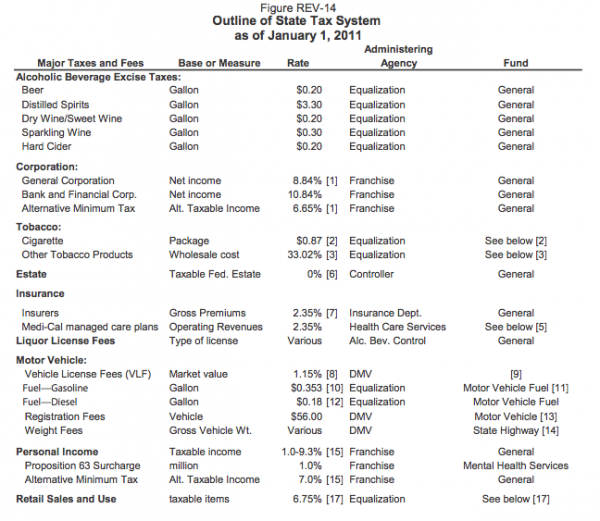 [from the Revenue Estimates section of the 2011-12 Proposed Budget]
Wondering what’s being done to get California out of the hole?
Here’s some extremely detailed maps to lay it all out for you:
 |
 |
| by County/City | by Congressional District |
[from recovery.ca.gov]
What’s more exciting than a state budget? Pretty much everything, but since you’re here and probably funding one, here’s a look at California’s expenditures from the last few years’ proposed and enacted budgets:
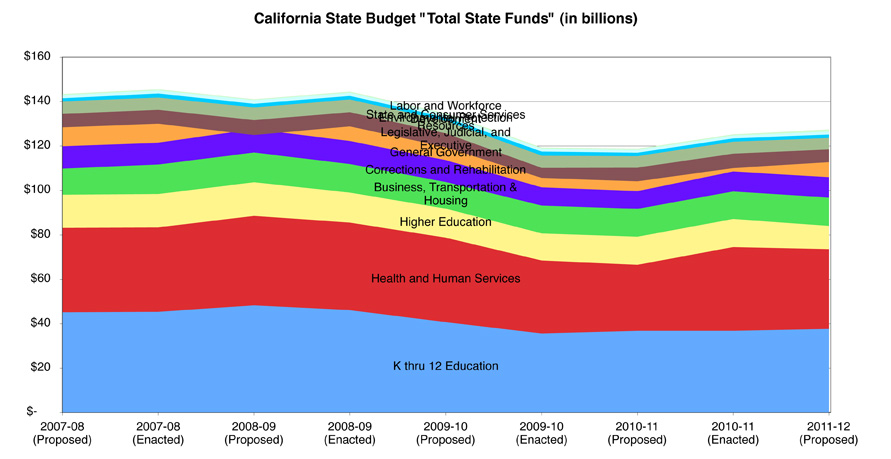 (click any chart to enlarge)
Yep, just what you’d expect: school and health and stuff. But where do the funds come from? Funds!
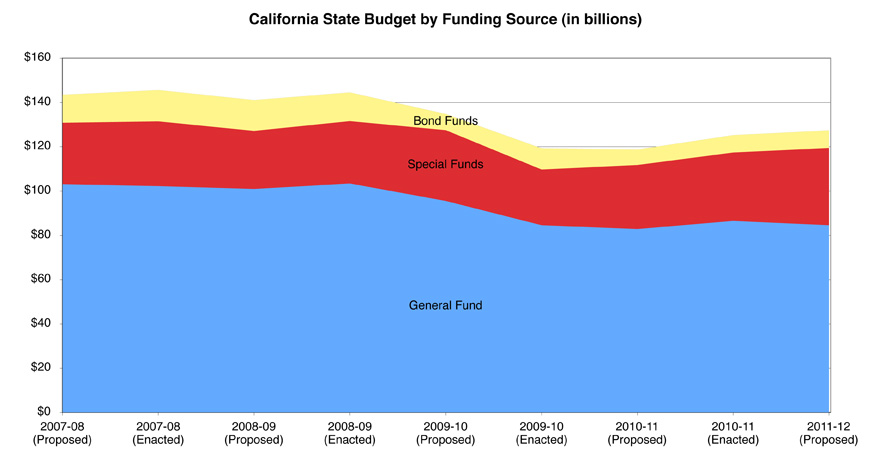
Don’t worry, it’s just taxes. Why bother with that chart? Because that’s the terminology, and facing it now might help overcome your inevitable and brutal lack of interest in the “General Fund” on the day you go and look at budget yourself. For now though, let’s take the bond figures from above with revenue summaries from the individual budgets and move on to the one slightly interesting chart in this set:
So technically, every time there’s a recession, less income will lead to less sales and therefore less tax, which basically guarantees that when the state is hurting, the government will be in no position to help. … Or is that not the problem?
We need more input.
[2011-2012 California State Budget, Historical Budgets from CA Dept. of Finance]
 (click to enlarge)
In his “California Lifestyles 1990” map, Dr. William A. Bowen of the California Geographical Survey used information from 5,855 census tracts to see who was living the dream and who wasn’t, and let’s just say, there’s apparently a lot of room at the bottom of the ladder.
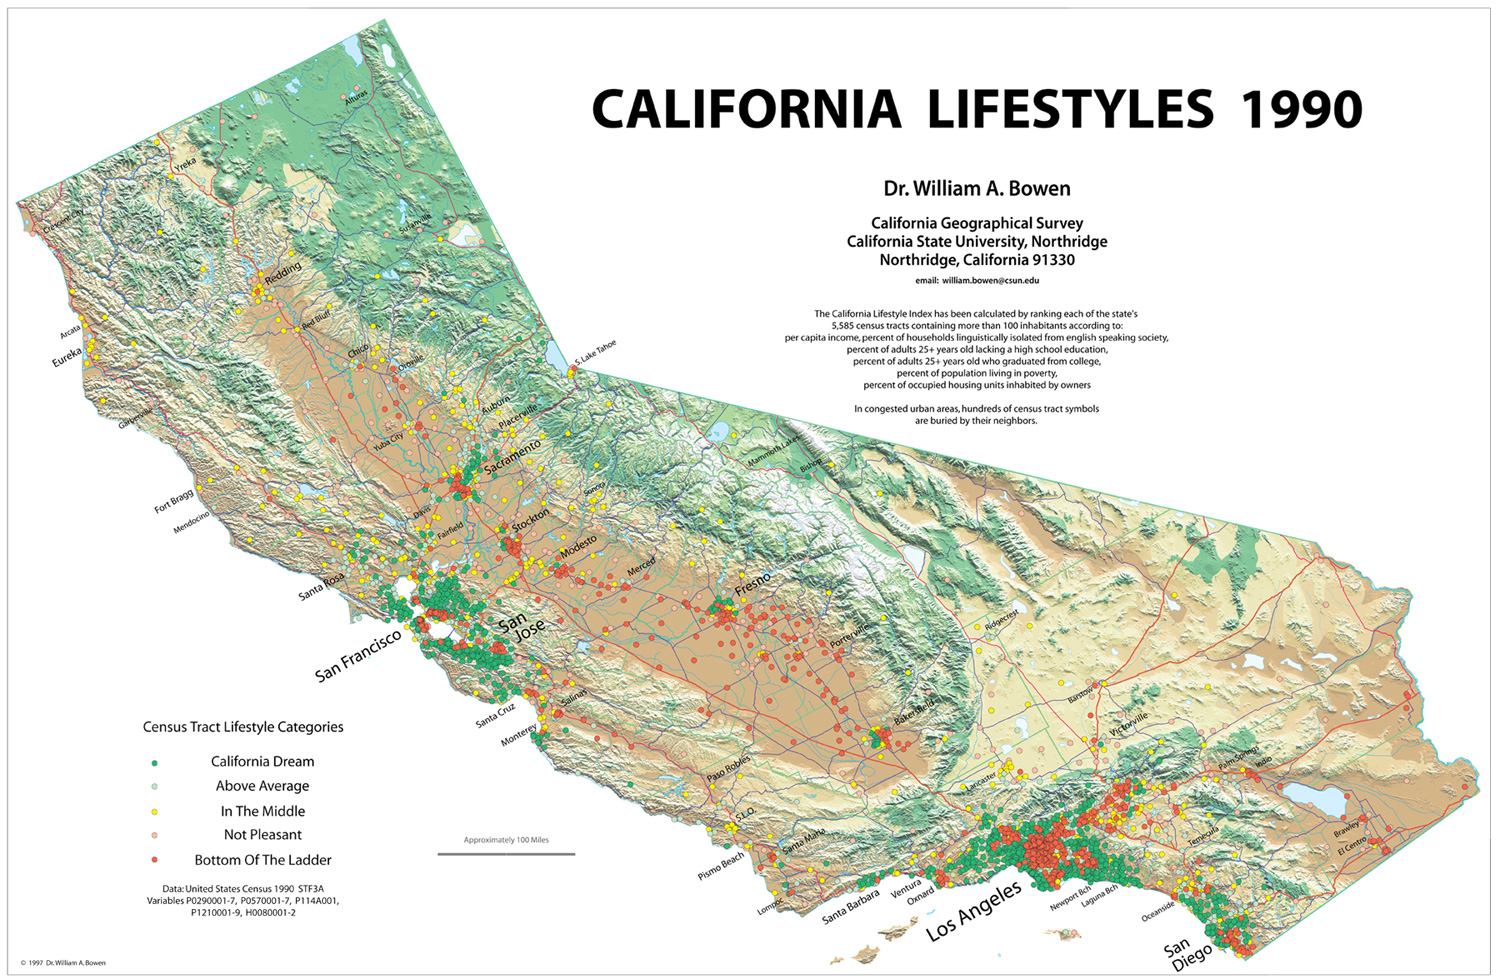 (click to enlarge – large file, but worth the wait)
[via California Geographical Survey (larger version available)]
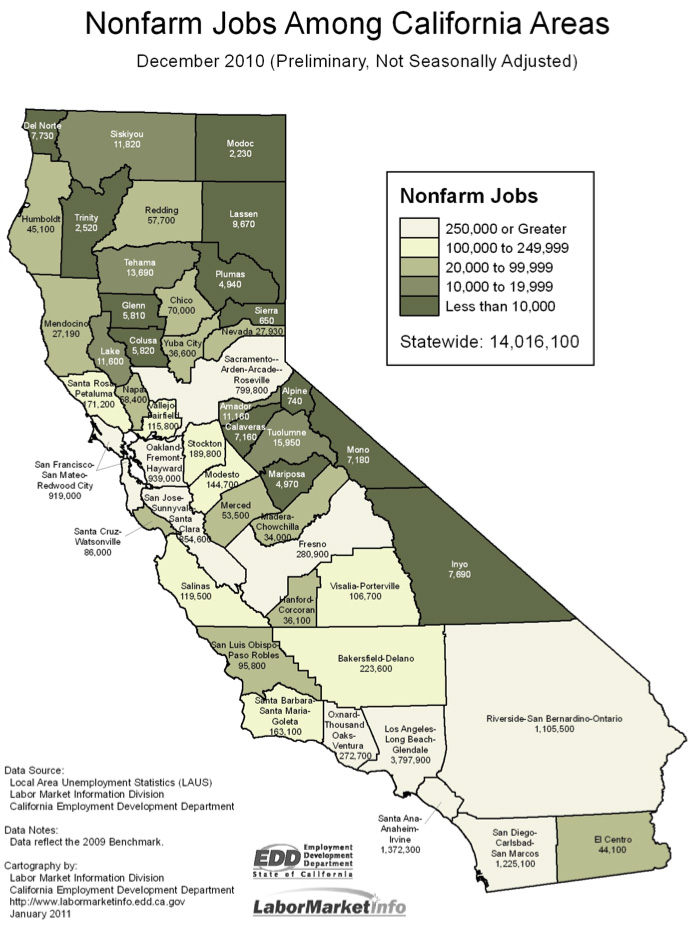
The maps tell one story. The legends tell another.
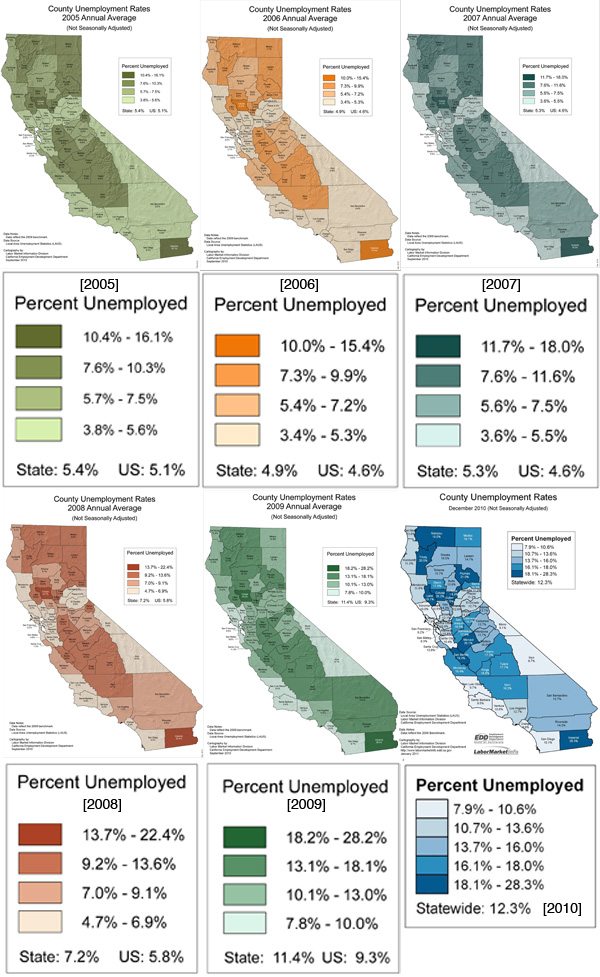
[PDFs available at California’s Employment Development Department]
With Silicon Valley and Hollywood in the deck, you’d hope California’s GDP would be more fun. Â But then you look and the largest industry is Real Estate and Renting and Leasing, i.e. paying to occupy existing structures. Â … Â I guess we have a very loose definition of economic output.
(You can switch Label and Color to get the second graph, but it’s nice to have them both going at once.)
For a refresher on economic sectors, check out the posts from 00019 – NAICS.
[Data via Bureau of Economic Analysis, Graphs made via Many Eyes]
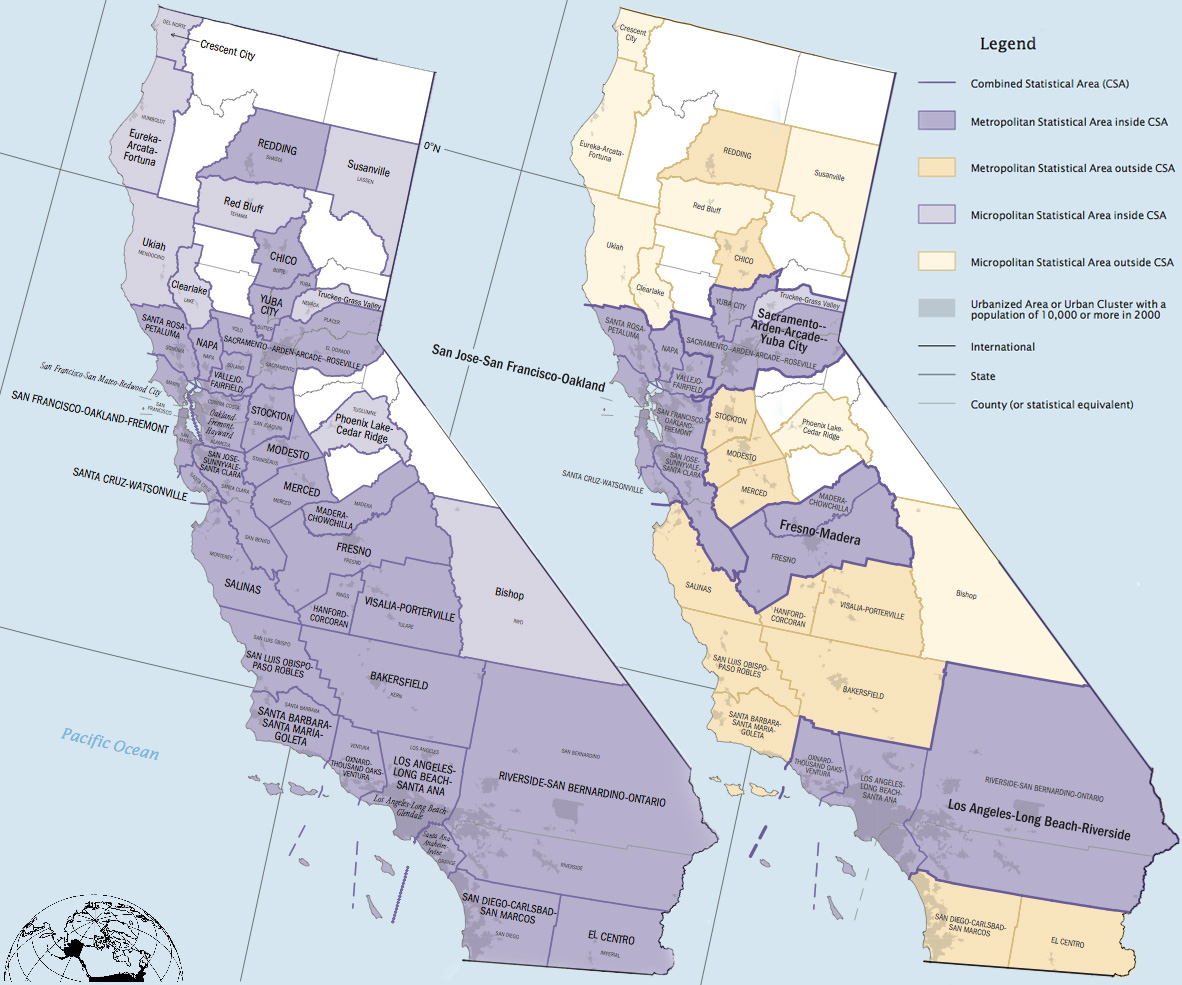 (click to enlarge)
[Dual map by ACM; Original U.S. maps available via U.S. Census Bureau]
In California, the real money is in the country…
 (click to enlarge)
[Population data via U.S. Census Bureau: State Pop, Metro Pop]
[GDP data via Bureau of Economic Analysis: State GDP, Metro GDP]
