Seedy Industry Structure: 1996-2008

From Philip H. Howard at Michigan State:

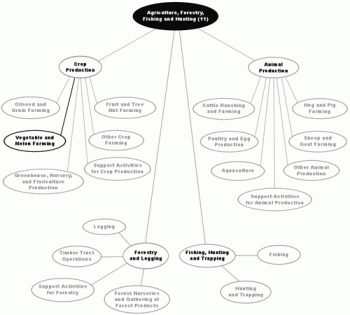
Consolidation has increased in the international seed industry in recent decades. The chart below depicts changes in ownership involving major seed companies and their subsidiaries, primarily occurring from 1996 to 2008. The largest firms are represented as circles, with size proportional to global commercial seed market share.
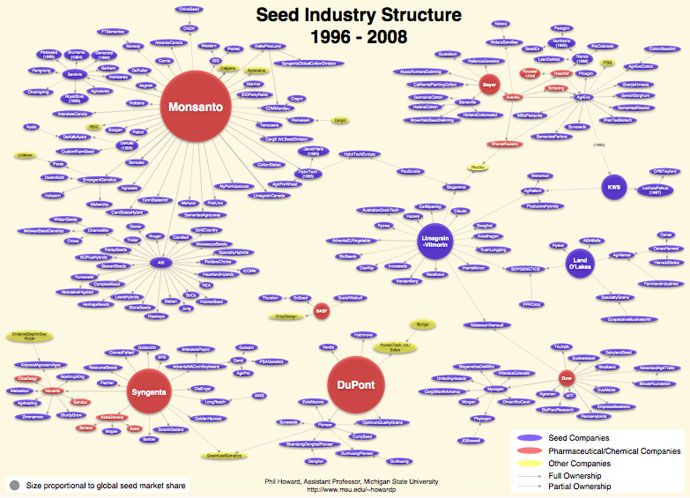
(click image to view zoom.it version)

Extra Credit: Count how many sound like food companies.
A Map of Where to Give Thanks

posted in: Ape Con Myth, Maps 0

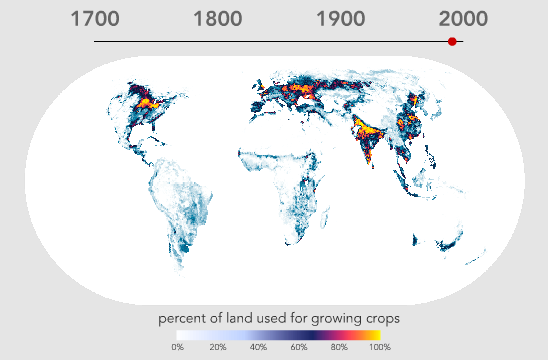
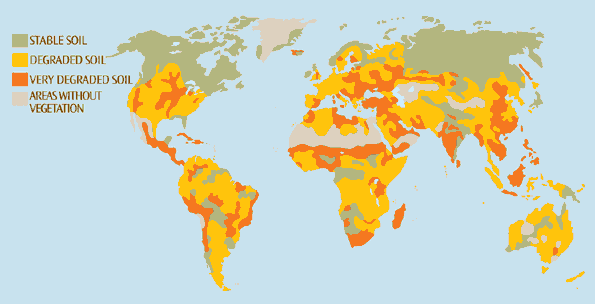
During hard times, being thankful for what we have comes a little easier.  Here’s a map to help guide your thoughts of thanks in regards to food.

But before you breath a sign of relief over there being so much room to grow more, remember that only 29% of the Earth’s surface is land and only 9% of it is arable.  And guess what, we’re not taking good care of it.

We have much to be thankful for, but it’s not a guaranteed condition.  They’ll still call it Thanksgiving, even if there’s hardly anything on your plate.  Just ask anyone with hardly anything on their plate.

[Map 1 from Radical Cartography, Map 2 from The Global Education Project]

Say Hello to Your PostNatural World

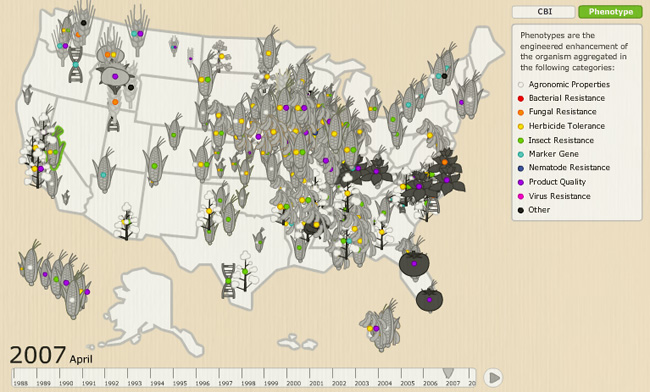
Don’t let the continued debate over genetically modified foods fool you.  Field tests of GMO’s have been going full steam ahead.  Below you can see what was tried out in April 2007 alone.

If you missed yesterday’s Millions Against Monsanto in honor of World Food Day, there’s still two weeks left in October, which just happens to be Non-GMO Month.  Remember, knowing is half the battle, even with genetically modified foods, and that’s the half we’re still working on.  Tell the FDA that the least they can do is label it.

[Map from Center for PostNatural History (Thanks, Mason!)]