Previously Ape Con Myth explored the history of the Dow Jones Industrial Average through the lens of the Tao Te Ching in a project known as The Tao Jones. Given the recent activity in the market, we have returned to that work to seek wisdom, or at least some perspective and an update on a couple of charts…
On day one, May 26th, 1896, the Dow closed at 40.94.
Yesterday, 31,246 trading days later, it closed at 11,236.77.
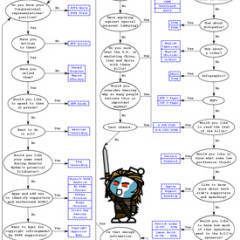
What happened in-between? Here’s everything:
 (click to enlarge)
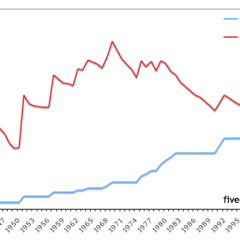
While there was plenty of drama beforehand, below we zoom into more recent history, starting in 1982 when the Dow left the 1k threshold behind after 18 years of bouncing between 800 and 1,000. Taking the powers of ten as developmental milestones, the Dow is currently working to leave 10,000 in the dust. It first crossed the line on March 29th, 1999. Since then it has recrossed that line 34 times, the last just under a year ago on August 27, 2010.
Don’t be surprised if it has to again.
 (click to enlarge)
Yet, all hope is not lost! Although they currently put the Dow around 9,500, Ape Con Myth’s ‘not-to-be-considered-investment-advice’ projections say dawn will break in mid-2013, with 30,000 waiting for us by the end of the decade.
But don’t rush to the end, start at the beginning…

The Dow Jones Before, During and After the Glass-Steagall Act » Ape Con Myth
[…] under Glass-Steagall, Ape Con Myth decided to dust off The Tao Jones data set and take another look at the full history of the Dow Jones Industrial Average, from 1896 through last […]