To and Fro, Internationally

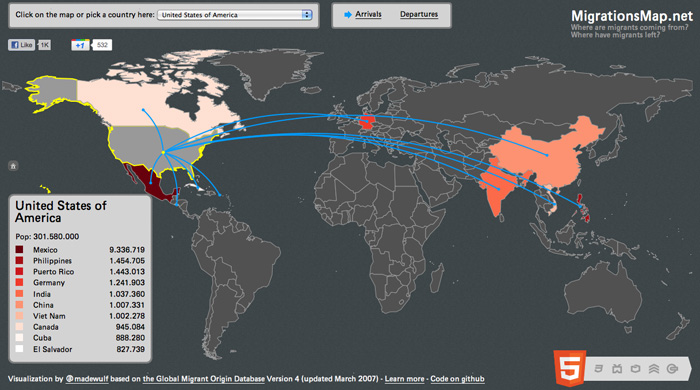
Ever thought about getting out of Dodge in a big way?  Looking for ideas?  At MigrationsMap.net, you’ll find a handy world map of information on where your fellow citizens have gone to and the origins of those who took their place…

The data comes from the Global Migrant Origin Database and gives a rough estimate of migrant populations circa 2000.  There were an estimated 175M migrants worldwide as of 2000, up from 75M in 1960.  But that’s only an increase from 2.5% to 2.9% of the total world population, which went from 3 billion-ish to 6 billion-ish in those same 40 years.

Anyway, here’s the list of lines that more than a million people have crossed, with the U.S. starting and finishing it off.
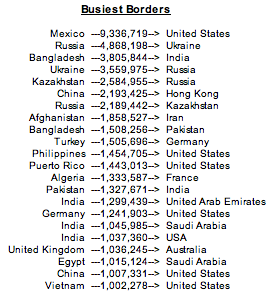
Pulling the full data set and counting up the complete totals for each country, the United States once again tops the list in positive net migration at 32.4M, with Mexico on the negative end of the spectrum at -9.7M.

But the impact of these numbers depend on the total population of each country.  Considering only countries with populations over one million, the United States comes in 15th in terms of migrant population as a percent of total 2000 population.  Meanwhile, Mexico falls just short of the list in regard to percent of population lost against the total population had no one left.

And finally, here’s the stats on all 24 countries with a population over 50M as of the 2000 censuses.
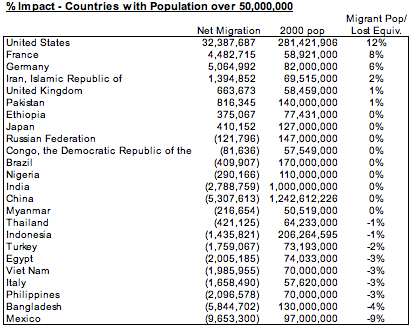
There’s a story behind every number on here.  Hopefully once we get all the numeric data visualized, the next wave of visual representations will work to connect the data to those stories.  We have so much data, but so little reference for it.

Plan for the Temporary Relocation of All U.S. Residents

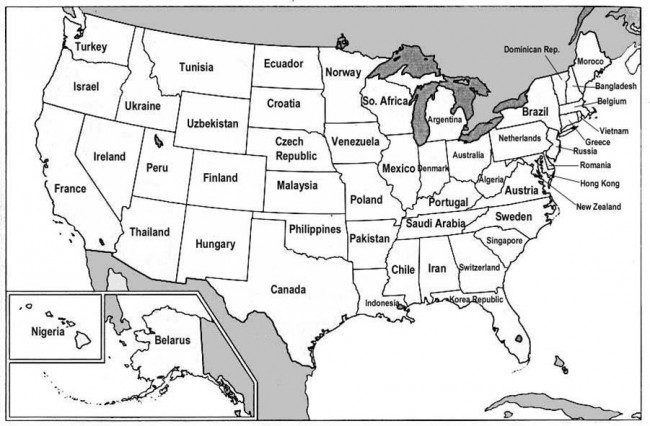
In response to continued economic hardship, Ape Con Myth recommends that the entire population of the United States take a vacation as soon as possible. Please refer to the map below to find your destination.  Each state has been assigned a foreign country with a comparable GDP.

USstatesCountryGDP

To complete the exercise, write a short essay on what your home state could learn from its economic counterpart, and vice versa.  Airlines are asked to provide pen and paper to all returning travelers for this purpose and to forward the collected works to Ape Con Myth for processing.  Wikipedia is an acceptable substitute for those who can’t afford the trip.  Your essays are welcome in the comments.

[Map via Big Think‘s Strange Maps; Thanks to scribblesabit]

Places to Avoid on the Weekend

Tourists.  Don’t live with them, can’t live without them?  Whatever the case, Eric Fischer’s Locals and Tourists map collection uses Flickr picture locations to show where you should or shouldn’t go, depending on your disposition, in 50 cities around the world.  Blue is for the peaceful locals and red for the invading tourists hordes…

Find these maps and much more at here.

[via Dohop Travel Blog]

United States Ecoregions

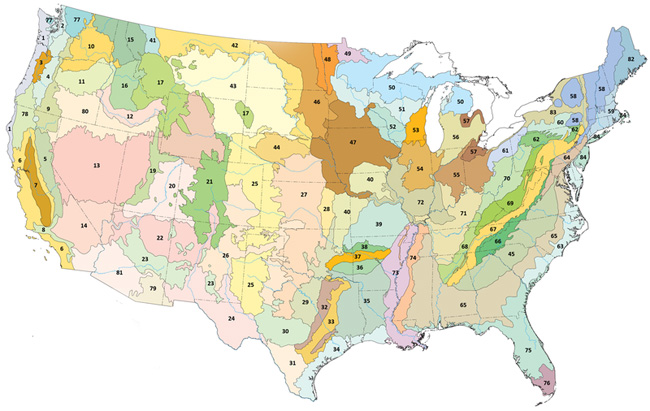
For states that are united, there sure are a lot of ways to break them down.  Most, however, are nothing much to look at compared with how nature’s divisions sketch out…

Click on the map to find out what all those numbers mean on Wikipedia, or if you want to go straight to the source, the EPA’s Western Ecology Division has some beautiful pdfs available for download, including state-level maps.

Honorable mention goes to the World Wildlife Fund’s list of U.S. ecoregions.  Always good to have a second source.

Get to Know Your Biomes

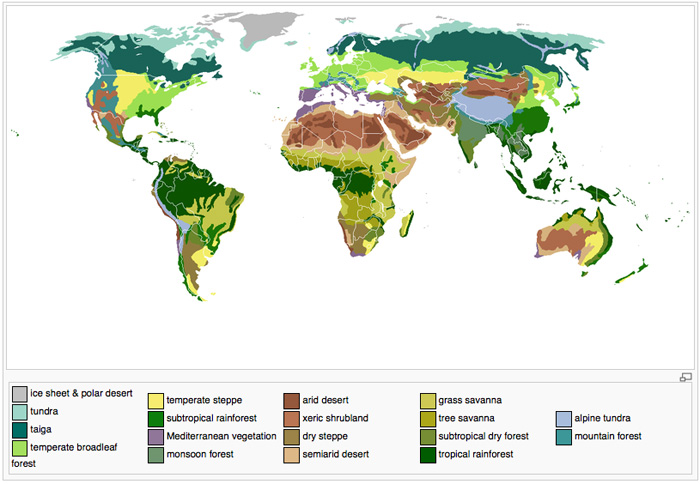
Looking to move to the other side of the world but don’t want to leave behind your favorite plants, animals and soil organisms?  Well, you don’t have to!  The ecosystem you know and love has counterparts (biomes) all over the globe…

WorldBiomeMapWarning: Does not apply to economic, political and cultural climates.

[Map from Wikipedia] [Related: Terrestrial Ecozone, Ecozones]

Population Density (or, What a Difference a Scale Makes)

posted in: Ape Con Myth, Input, Maps 0

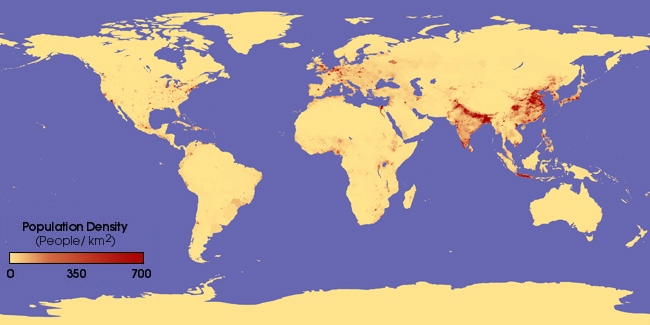
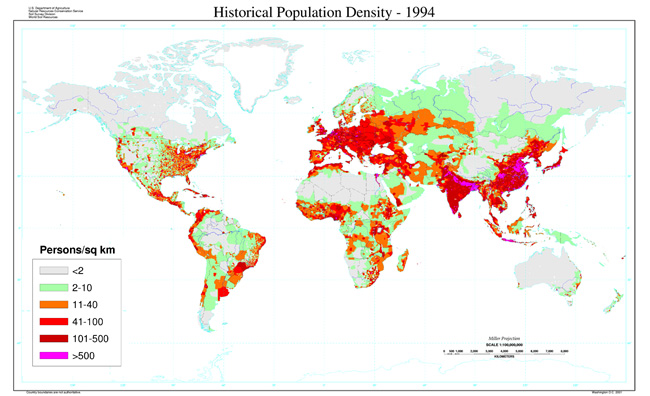
The year, 1994.  The world’s population, 5.6 billion.  How bunched up were we then?

Plenty of room to breathe, right?  But where is everyone else?

Suddenly it’s getting a little crowded in here, particularly considering most of the grey area is quite inhospitable.  Thankfully there’s no one around to call us an invasive species.

Other population density info:

[1994 Maps from NASA, NRCS]

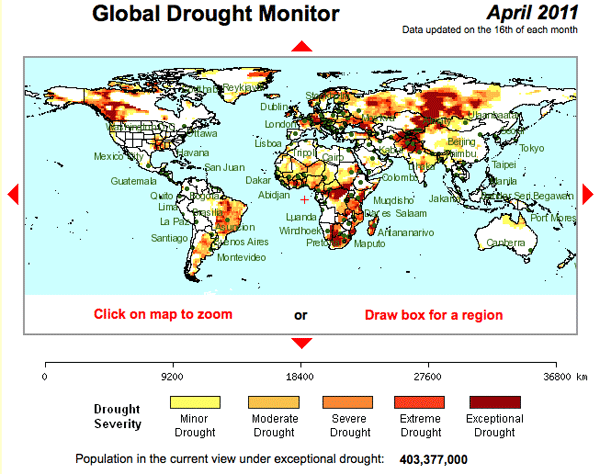
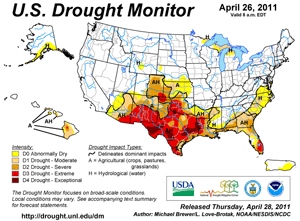
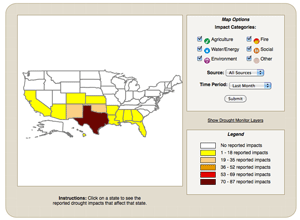
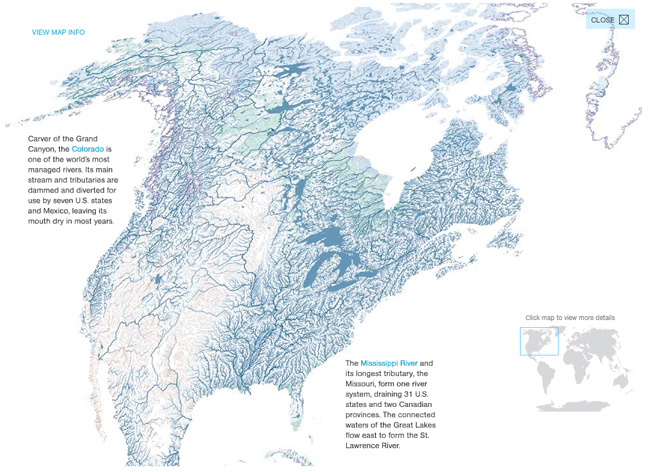
The Necessities –> Water –> Drought

posted in: Ape Con Myth, Input, Maps 0

GlobalDroughtMonitor

USDroughtMonitor USDroughtImpact
U.S. Drought Monitor Drought Impact Reporter

Dear Humans, I Don’t Need Most Of You To Be That Smart. Sincerely, The Economy

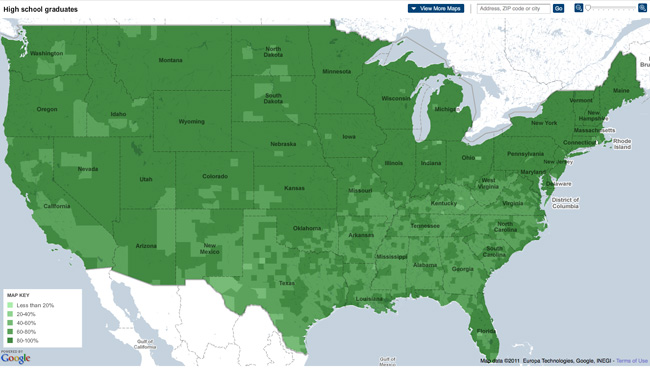
Here’s some lush U.S. high school graduation rate census data for you.  The lighter the green, the lighter the course load…

HighSchoolGrads-NYT

(click for live map where you can drill down into the gory details)

That is a lot of people not doing their homework.

On the other hand, if there are more college and PhD graduates than the economy can handle, then the same likely applies to high school grads, though who would want to admit that?

It’s not the economy, stupid.  It’s a stupid economy.

[Map from NYTimes]

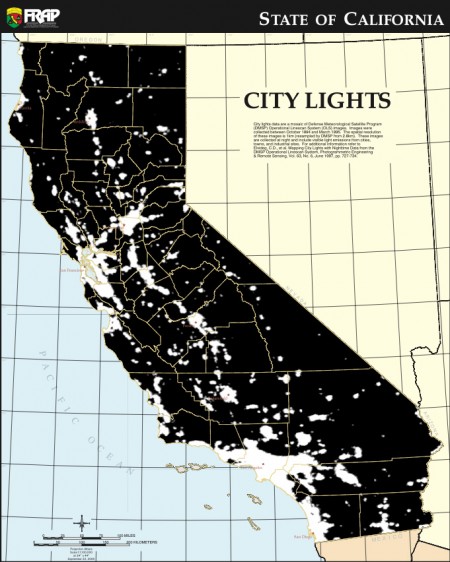
When the lights go down in the city?

I want to be there.

CA_city_lights_map(click for slightly larger version)

“City lights data are a mosaic of Defense Meteorological Satellite Program (DMSP) Operational Linescan System (OLS) images.  These images were collected at night (10/1994-3/1995) and include visible light emissions from cities, towns, and industrial sites.”

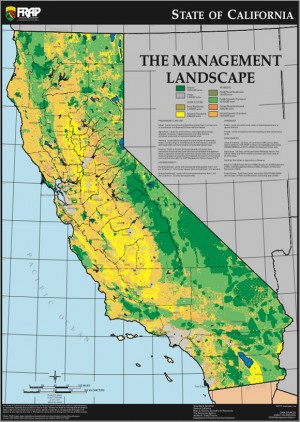
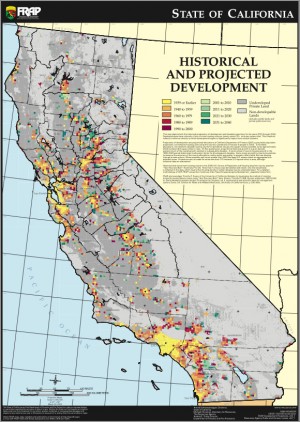
[Full version available in the excellent FRAP Maps collection from the CA Department of Forestry and Fire Protection.]

1 2 3 4 5 6